

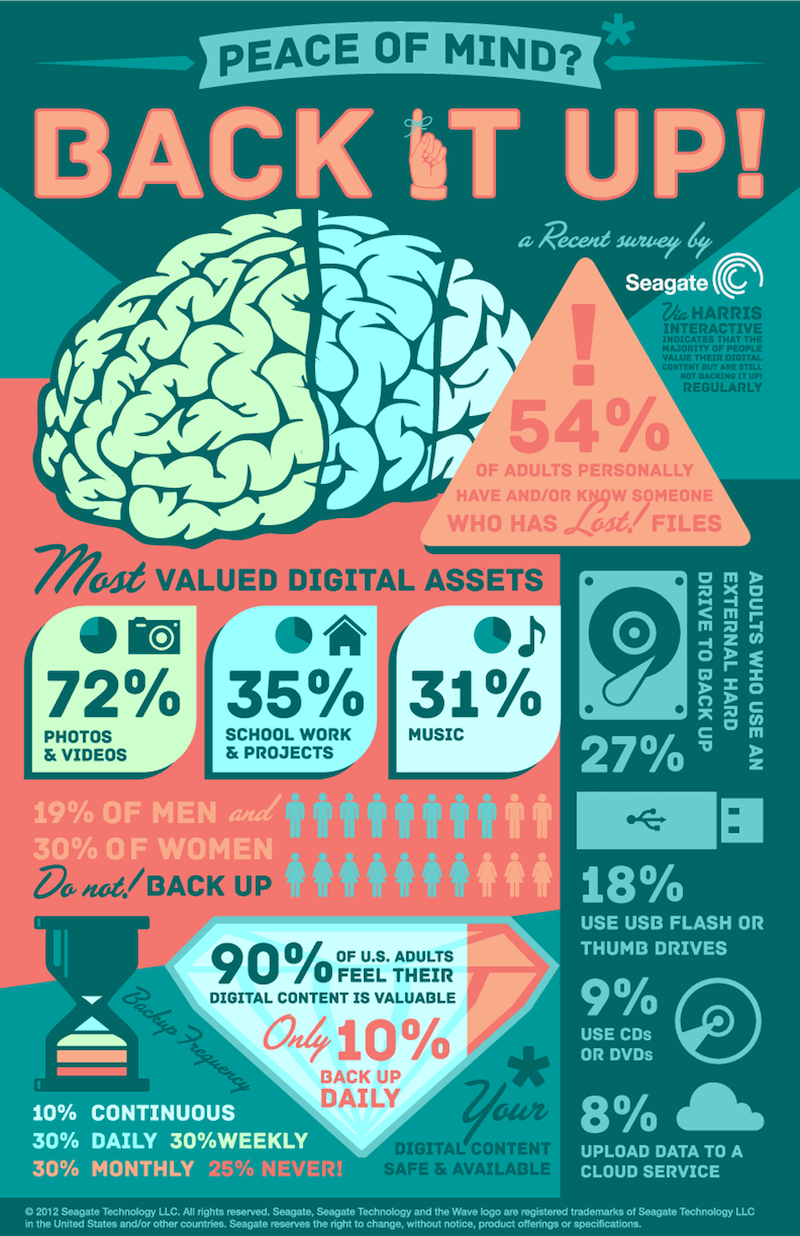
Infographics have been around for years, but in 2026 they are more valuable than ever.
That might sound surprising at first. After all, audiences now scroll faster, attention spans are shorter, and there is more content online than anyone could possibly consume. Many people assume infographics are “old-school” content.
But the reality is the opposite.
In 2026, the internet is overloaded with long text, repeated opinions, and generic social media posts. People do not just want more information. They want clear information.
And that is exactly what a great infographic provides.
A well-designed infographic takes complexity and turns it into clarity. It helps people understand, remember, and share information quickly. It gives businesses a way to communicate value without forcing audiences to read long paragraphs. It also creates content that performs well across platforms like LinkedIn, Instagram, blogs, reports, email newsletters, and even pitch decks.
The best infographics of 2026 are not just “pretty visuals.” They are strategic communication tools. They are designed to influence decisions, shape opinions, and guide action.
This article explores the best infographic examples of 2026—not by listing brand names, but by breaking down the formats, styles, and structures that are winning right now. You will learn what works, why it works, and how businesses can apply these strategies to their own infographic design and marketing.
If you are a business owner, marketing manager, content creator, or brand looking to improve communication and engagement in 2026, these examples will help you understand what world-class infographics actually look like today.
Why Infographics still work so well in 2026
Before we look at specific examples, it helps to understand why infographics remain powerful even in a fast-scrolling digital world.
People today are overwhelmed with content. They are receiving information through social feeds, emails, news updates, and search results all day long. When content feels too long, too complicated, or too time-consuming, people skip it.
Infographics win because they reduce effort.
They allow the audience to understand something quickly. They create “instant clarity”, which makes them more shareable and more memorable. In 2026, this matters more than ever because brands are competing for attention in crowded spaces.
Infographics also work because they align with how people learn. Many people absorb information visually faster than through text alone. A simple chart, timeline, or visual comparison can communicate more in five seconds than a long paragraph can communicate in one minute.
That is why infographics are still used heavily by the most effective organizations in 2026, including tech companies, healthcare brands, financial firms, educators, government agencies, sustainability teams, and B2B marketers.
The infographic has evolved, but it has not disappeared.
What Makes an Infographic “One of the Best” in 2026?
The best infographic examples of 2026 share a few consistent characteristics.
First, they are built around one clear message. They do not try to explain everything. They focus on one problem, one topic, or one journey. That focus creates clarity.
Second, they are designed for the platform they will be consumed on. In 2026, a single infographic might be created in multiple versions: one for LinkedIn carousel posts, one for a blog, one for email, and one for a presentation. The core message stays the same, but the format adapts.
Third, they prioritize readability. The best infographics do not overload the viewer with text. They use short sentences, clear hierarchy, and strong spacing.
Fourth, they feel credible. They include data sources when needed, and they use charts that match the claims. The design supports the truth, not hype.
Finally, they guide the viewer. The layout is structured so the audience knows exactly where to look next. There is a beginning, a middle, and an end. A good infographic feels like a story, not a random collection of visuals.
With those principles in mind, let’s explore the most effective infographic examples of 2026 and why they work.
Example 1: The “Data Snapshot” Infographic (Simple, Fast, Highly Shareable)
One of the most popular infographic styles in 2026 is the data snapshot.
This type of infographic usually presents a small number of key statistics, often between three and seven, supported by icons, simple charts, and strong typography. It is designed for speed. It can be understood in seconds, and that is why it performs so well on social media.
Data snapshots work because they match modern attention patterns. People do not want to read long reports unless they are already deeply interested. A snapshot gives them a quick understanding and encourages them to click for more.
This format is widely used for business and marketing content. A company might publish a snapshot on trends in their industry, customer behavior changes, or performance metrics from a recent survey.
The design strength here is discipline. The best data snapshots do not try to include everything. They choose the most impactful numbers, make them easy to read, and support them with clean visuals.
In 2026, the most successful snapshot infographics also use design to guide emotion. They use large, confident numbers, and they highlight key takeaways so the viewer understands the significance of the data, not just the data itself.
Example 2: The “Step-by-Step Process” Infographic (Perfect for Education and SEO)
Another top infographic format in 2026 is the step-by-step process infographic.
This style breaks down a complicated process into clear stages. It is commonly used for educational content, training resources, onboarding guides, and how-to blogs.
Step-by-step infographics work because they reduce confusion. They make learning feel manageable. Instead of overwhelming the viewer, they offer a sequence.
This format is especially effective for industries like education, finance, health, software, and consulting, where people need guidance through multi-step decisions.
In 2026, these infographics are often built in a way that supports Google search intent. People searching online for solutions often type questions like “How to…” or “Step-by-step guide to…”
A blog that includes a process infographic tends to perform better because it improves user experience. Readers stay on the page longer, understand faster, and are more likely to share or save the content.
The best process infographics of 2026 combine minimal text with clear structure. They use numbered steps, consistent icons, and visual direction so the viewer naturally follows the flow.
Example 3: The “Comparison Infographic” (High Conversion for Business Decisions)
Comparison infographics are dominating in this year as one of the best infographic examples of 2026, especially for brands that want to influence buyer decisions.
This format presents two or more options side-by-side and compares them clearly. It may compare products, services, strategies, or outcomes.
Comparison infographics work because they align with how people make decisions. Buyers rarely choose something in isolation. They compare.
In business marketing, comparison infographics often improve conversions because they simplify decision-making. They help the viewer understand differences quickly and reduce analysis paralysis.
In 2026, the best comparison infographics do not feel biased or overly salesy. They present differences honestly, and the design naturally highlights why one option is more suitable depending on context.
This builds trust.
Trust is the foundation of conversion.
Example 4: The “Timeline Infographic” (Perfect for Storytelling and Brand Authority)
Timeline infographics are still one of the strongest formats in 2026 for storytelling.
This style shows how something changes over time. It can be used for brand history, industry evolution, product development, or trend forecasting.
Timelines work because they feel natural. Humans understand time-based storytelling easily.
A timeline infographic makes a brand look authoritative because it shows an understanding of progression. It communicates that the creator has studied the past and can explain how things reached the present moment.
In 2026, timeline infographics are also used heavily for “future of” content, because audiences are interested in predicting changes. A strong timeline helps the viewer connect patterns and see what might happen next.
The best timeline infographics of 2026 keep the layout simple. They avoid clutter. They use strong spacing, short captions, and visual emphasis on major milestones rather than every small detail.
Example 5: The “Framework Infographic” (Best for Thought Leadership)
One of the strongest business infographic formats in 2026 is the framework infographic.
This style presents a conceptual model, such as a method, formula, system, or decision map. It is often used by consultants, educators, coaches, and B2B companies to communicate their unique approach.
Framework infographics work because they give people language for understanding complexity.
For example, a company might share a framework for customer retention, productivity, digital transformation, or brand strategy. The infographic becomes a reusable mental model for the audience.
This format performs extremely well on LinkedIn, especially as carousels, because professionals like to save frameworks for later.
The best framework infographics in 2026 are visually clean and structured. They avoid long paragraphs and focus on key terms, clear grouping, and strong hierarchy.
A framework infographic is not about showing data.
It is about showing thinking.
And in 2026, thinking is a competitive advantage.
Example 6: The “Myth vs Fact” Infographic (High Engagement and Shareability)
Myth vs fact infographics are a top-performing style in 2026 because they trigger curiosity and debate.
This format works because it challenges beliefs.
People are naturally drawn to content that makes them rethink something. When myths are corrected through clear facts, the content becomes both informative and emotionally engaging.
This style is commonly used in healthcare, finance, sustainability, education, and tech. It is especially powerful in industries where misinformation spreads quickly.
The key design strength of myth vs fact infographics is contrast.
The best examples use visual contrast to separate myth from fact clearly. They make it easy to scan quickly. They avoid overly aggressive tone and instead aim for clarity and credibility.
When the tone stays respectful, myth vs fact infographics become educational rather than argumentative.
Example 7: The “Customer Journey” Infographic (Perfect for Marketing and UX)
Customer journey infographics have become extremely popular in 2026, especially for SaaS companies and service businesses.
This format shows the stages a customer goes through, from awareness to purchase to retention.
It works because it helps businesses communicate empathy. It shows that the company understands the customer’s experience, pain points, and decision-making process.
In marketing, customer journey infographics are powerful because they help teams align internally. They also help clients and stakeholders understand marketing strategy in a visual way.
The best journey infographics in 2026 are story-driven. They do not look like corporate diagrams. They feel relatable and human. They use clear emotions, simple language, and visual progression that makes the viewer feel the journey.
Example 8: The “Interactive and Modular Infographic” (Built for Multi-Use Content)
While traditional static infographics remain strong, 2026 has seen growth in modular infographic design.
Modular infographics are designed as individual visual blocks that can be separated and reused across platforms.
For example, a brand might create one “master infographic,” then break it into:
- A LinkedIn carousel
- An Instagram post series
- A blog header graphic
- Presentation slides
- Email visuals
This works because it increases content efficiency.
Instead of producing new content every day, brands repurpose one visual story across multiple formats.
This is especially important in 2026 because marketing teams are under pressure to produce more content faster without sacrificing quality.
The best modular infographics are designed with flexibility in mind. Each section has its own message, and the entire design still flows as one story.
Example 9: The “Minimalist Data Visualization” Infographic (Premium and Professional)
The best infographic examples of 2026 includes one of the most noticeable design trends this year: premium minimalism.
Many brands are moving away from loud colours and heavy decoration and toward clean, elegant design that feels modern and high-value.
Minimalist data visualization infographics focus on:
- Whitespace
- Typography hierarchy
- Simple icons
- Clean charts
- Short text
This format works especially well in finance, technology, consulting, and corporate communication.
Minimalism works because it signals confidence.
A brand that uses clean design appears organized and credible. The viewer feels that the information is trustworthy and intentional.
In 2026, minimalist infographics are also more accessible. They are easier to read on mobile and reduce visual fatigue.
Example 10: The “Explainer Infographic” (Best for Complex Topics)
Explainer infographics are extremely valuable in 2026 because many industries are dealing with complexity.
AI, cybersecurity, sustainability reporting, compliance standards, digital transformation, and evolving consumer behavior are not easy topics to explain quickly.
Explainer infographics break complexity into simple chunks.
They work because they remove fear. When people understand something, they feel more confident. When they feel confident, they are more likely to act.
This is why explainer infographics perform well for both education and marketing. They build trust while also positioning the brand as knowledgeable.
The best explainer infographics of 2026 use clear structure. They define terms, show cause-and-effect relationships, and avoid technical language unless necessary.
They treat the viewer like an intelligent person who simply needs clarity.
Why these ‘Best Infographic Examples of 2026’ work so well
When you look across the best infographic examples of 2026, these deep underlying reasons explain their success all too well:
- They respect the viewer’s time and, therefore, deliver clarity fast.
- They respect the viewer’s attention. They guide the eye with structure rather than forcing effort.
- They respect the viewer’s intelligence. They simplify without oversimplifying.
- They respect the viewer’s emotions. They reduce overwhelm and confusion, which increases trust.
The best infographics are not just design-based. They are based on a solid communication strategy.
How Businesses can apply these Infographic Principles in 2026
If a business wants infographic content that performs well in 2026, it should start by focusing on message clarity.
The question is not “What can we design?”
The question is “What does our audience need to understand quickly?”
Once that is clear, the format becomes easier to choose. A snapshot works for key statistics. A comparison works for decision-making. A framework works for thought leadership. A timeline works for storytelling.
The next step is to design for platform behavior. A blog infographic is usually taller and more detailed. A LinkedIn infographic should be broken into readable slides. An Instagram infographic must be visually bold and quick.
Then comes the most overlooked factor: consistency.
Brands build authority by showing consistent quality. In 2026, audiences trust brands that communicate clearly again and again. Infographics help because they create a recognizable style and structure.
Over time, this becomes a competitive advantage.
Final Thoughts: The Best Infographics of 2026 are built for Clarity, not Decoration
Infographics are not going away.
In 2026, they are evolving into one of the most useful content formats for modern communication. They help businesses explain complex ideas quickly. They improve engagement. They increase shareability. They boost SEO through better on-page experience. They support marketing, sales, onboarding, and training.
The best infographic examples of 2026 all succeed because they do one thing extremely well:
They make information easy to understand.
If you want to create infographics that perform in 2026, focus less on “making it look nice” and more on “making it instantly clear.”
When clarity and design work together, infographics become one of the most powerful tools your brand can use.


