

By Infographic Designers – Experts in Data Visualization and Infographic Design UK
In today’s fast-paced digital landscape, attention spans are short and data is abundant. Whether you’re a business owner, marketer, educator, or data analyst, presenting complex information in a way that’s both engaging and easy to digest is critical. That’s where infographics come in.
However, not all infographics are created equal. Choosing the right infographic style for your data can make or break your message. In this guide, we’ll help you understand different infographic formats and how to choose infographic types based on your goals and audience.
Why Infographic Style Matters
The design and layout of an infographic directly influence:
- Clarity of your message
- Audience engagement
- Information retention
- Shareability and SEO value
A well-designed infographic can elevate your brand’s credibility, drive traffic to your website, and even improve your search rankings when embedded and shared. Furthermore, the types of infographics you end up choosing can dramatically impact how people digest the information or the action they take as a result, for that matter.
Infographic Styles Explained and When to Use Them
Let’s explore the most common types of infographics and which data scenarios they’re best suited for.
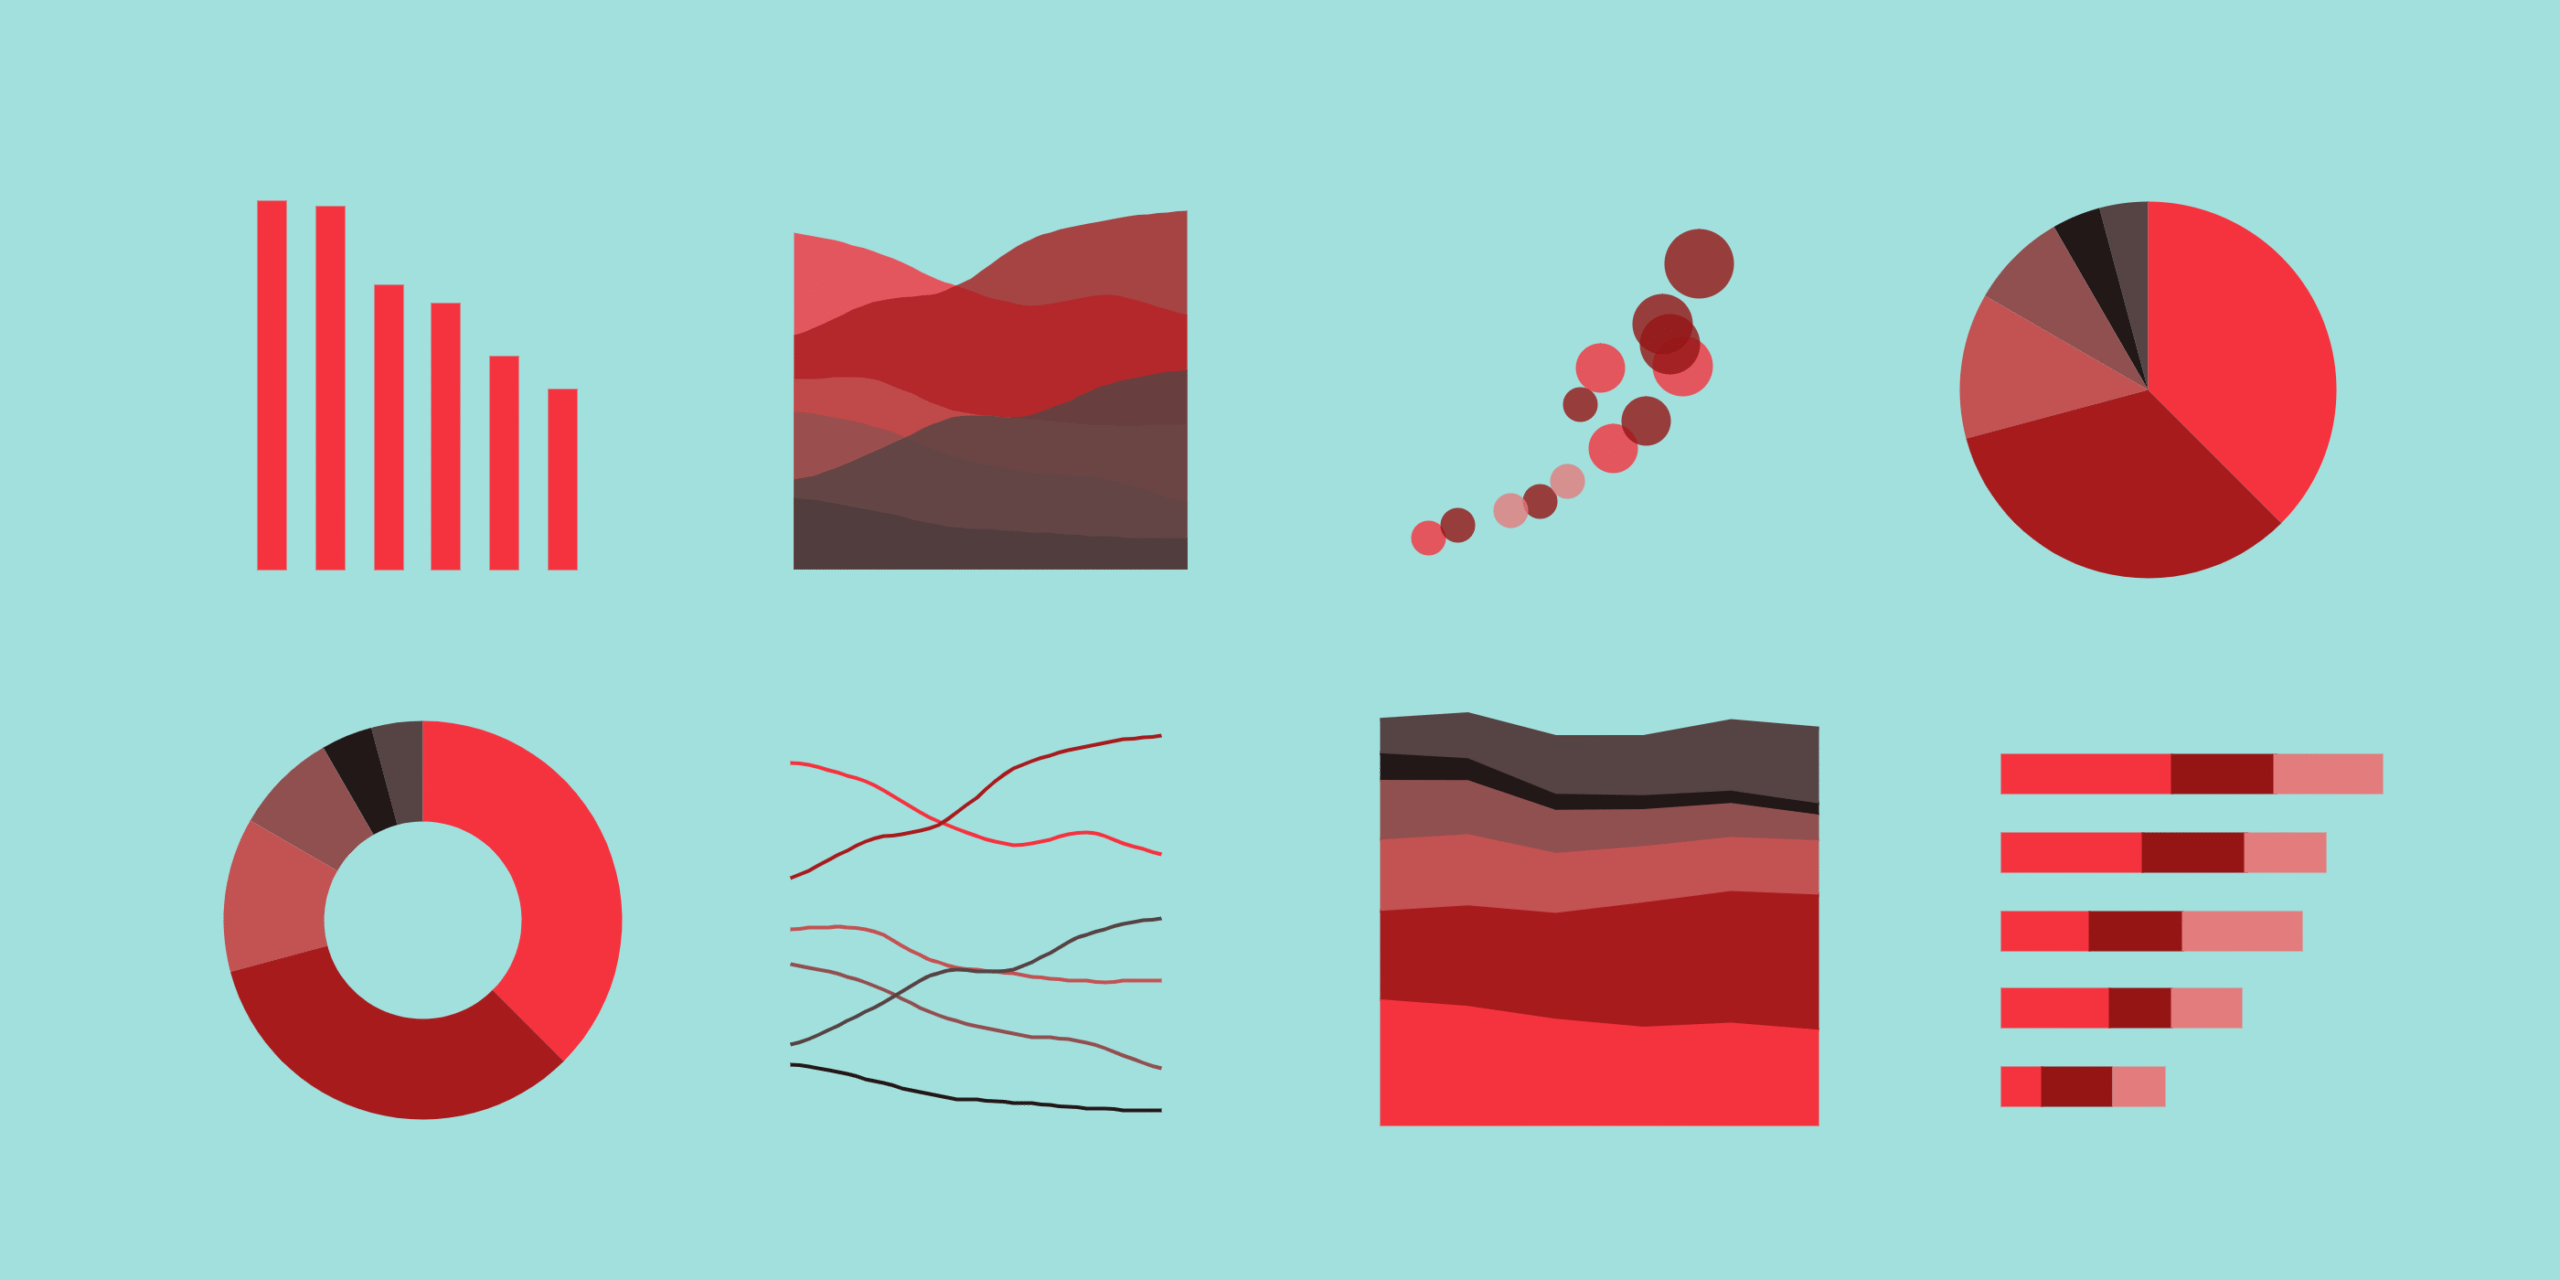
- Statistical Infographics
Best for: Presenting survey results, research data, or statistical comparisons.
What it includes:
- Charts (bar, line, pie)
- Percentages and ratios
- Number call-outs
- Icons and illustrations to enhance data
When to use it:
Use this style when you want to communicate quantitative data that proves a point or backs a claim. For example: “65% of UK marketers use infographics in their content strategy.”
- Informational or List Infographics
Best for: Step-by-step guides, tips, or checklists.
What it includes:
- Bold headings and concise text
- Visual cues like arrows and icons
- Clear, sequential flow
When to use it:
These types of infographics are ideal for simplifying non-numerical content or long blog posts. Think “10 Ways to Improve Email Engagement” or “5 Steps to Prepare for a Product Launch.”
- Timeline Infographics
Best for: Showing historical developments, company growth, or project timelines.
What it includes:
- A chronological layout (horizontal or vertical)
- Milestone markers
- Images or icons representing each event
When to use it:
Use when telling a story over time, such as “The Evolution of Social Media” or “Our Company’s Journey Since 2000.”
- Process Infographics
Best for: Explaining workflows or how something works.
What it includes:
- A beginning and end point
- Linear or cyclical flow
- Arrows, paths, and visuals that guide the viewer
When to use it:
Perfect for onboarding new customers, training employees, or visualising complex internal processes like “How SEO Works” or “Our Design Process.”
- Comparison Infographics
Best for: Highlighting differences between two or more options.
What it includes:
- A split layout (side-by-side)
- Direct comparisons (pros/cons, this vs. that)
- Use of colour contrast and icons
When to use it:
Ideal for buyers’ guides, marketing materials, or “before and after” case studies. All in all, a great infographic for data storytelling. For example, “Google Ads vs SEO” or “Freelancer vs Agency”, and then you can add unique points to your narrative to further build the case for whatever you support or don’t support.
- Geographic Infographics (Maps)
Best for: Displaying data across regions or countries.
What it includes:
- Interactive or static maps
- Data points overlaid on geography
- Colour coding and regional insights
When to use it:
Use when presenting location-based data, such as “UK Regions with the Highest Energy Consumption” or “Global Market Share by Continent.”
- Hierarchical Infographics
Best for: Explaining ranked structures, such as food chains, organisational charts, or tiered service packages.
What it includes:
- Pyramid or tree diagrams
- Levels or layers of data
- Visual hierarchy and clear alignment
When to use it:
Perfect for showing relationships between elements or breaking down complex frameworks.
How to Choose the Right Infographic Style
Here are 5 key questions to guide your decision in order to choose infographic type:
- What’s the main goal of the infographic?
- Want to present data findings? → Statistical
- Need to educate or guide? → List or Process
- Telling a story or journey? → Timeline
- Want to compare options? → Comparison
- What type of data are you presenting?
- Numerical data → Use charts and graphs (Statistical)
- Text-heavy info → Use bullet points and icons (List)
- Time-based events → Use visual timelines
- Who is your audience?
- Executives: Clean, minimal, data-driven designs
- General public: Visual-heavy, colourful, simple language
- Children/students: Fun icons, bold colours, minimal text
Tailor tone and style based on who will consume the infographic.
- How will it be used?
- Social media: Shorter, mobile-friendly formats
- Blogs or websites: Vertical, detailed designs
- Presentations: Modular or slide-friendly layouts
Match format with distribution channel to maximise engagement.
- Do you want static or interactive content?
- Static infographics are best for print or fast loading on mobile.
- Interactive infographics (with clickable charts or animations) work well for websites and investor dashboards.
Always ask your infographic designer or infographic agency (UK-based) what’s possible within your budget and brand guidelines.
Bonus Tip: Blend Styles Creatively
In real-world use, infographic types often overlap. A timeline infographic style, for instance, can include statistics. A process flow infographic type can end with a comparison. Don’t hesitate to blend formats to best serve your message—as long as clarity remains your priority.
Work With the UK’s Leading Infographic Experts
At Infographic Designers UK, we help brands, agencies, and publishers turn raw data into compelling visuals. Whether you’re presenting to investors, publishing content on your blog, or launching a product, we’ll match your message to the ideal infographic style—and design it for maximum clarity and visual appeal.
Some of the clients we’ve had the privilege of working with include NHS, Barclays, Deloitte, and hundreds of SMEs across the UK.
Choose the right infographic style for your data now—let’s bring that data to life.


