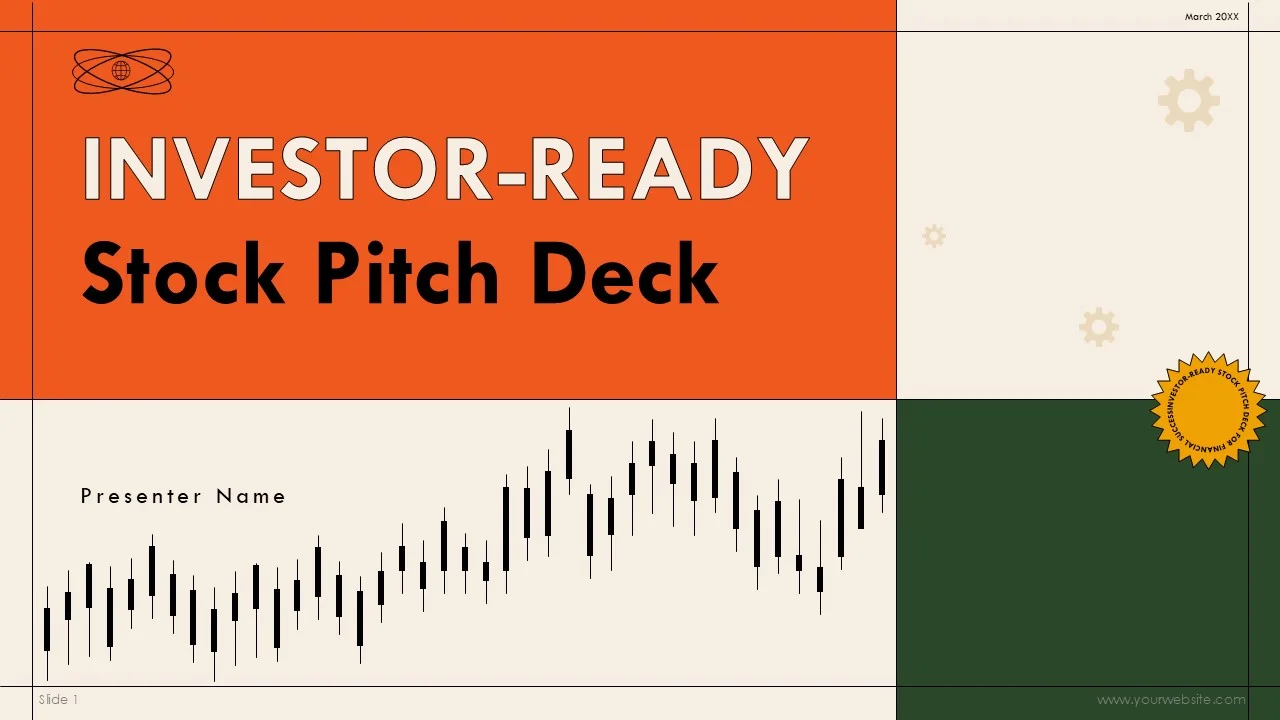
The role of infographics in pitch decks has grown dramatically over the last few years. Investors are busier than ever, and the volume of startup pitches has increased thanks to global online funding platforms and remote pitching.
Because of this, attention has become the most valuable currency.
An investor often decides within the first few minutes whether a pitch is worth deeper consideration. Clear visuals help communicate key ideas instantly, reducing the mental effort required to understand a business model.
Infographics serve several important purposes in a pitch deck. They simplify complex information, highlight important numbers, show relationships between ideas, and make presentations more memorable. Most importantly, they help founders control the narrative by guiding investors toward the conclusions they want them to reach.
In 2026, a pitch deck without strong infographics feels outdated and incomplete. Let’s go ahead and see what it takes to create really great investor pitch deck infographics in 2026.
Understanding What Investors Really Want to See
Before designing any infographic, it is essential to understand the mindset of investors.
Investors are not primarily interested in beautiful design. They care about opportunity, risk, and potential return. Every visual in a pitch deck should help answer one of their core questions:
Is this a large and growing market?
Does this company have real traction?
Is the product clearly differentiated?
Can the business model scale?
Is the team capable of executing the plan?
The purpose of pitch deck infographics is to present evidence that answers these questions clearly and convincingly.
When designers and founders focus on these investor priorities, infographics become strategic tools rather than decorative elements.
Start With Strategy, Not Software
One of the biggest mistakes founders make when creating investor pitch deck infographics is jumping straight into design tools.
Great investor infographics begin with planning. Before creating a single chart or diagram, you must decide what story you are trying to tell.
Ask yourself what the main message of each slide should be. What do you want the investor to believe after seeing this visual? What doubts are you trying to remove?
In 2026, the most effective pitch decks are built around a logical narrative arc. Infographics should be designed to support that narrative step by step.
Good strategy always comes before good design.
Define the Key Messages for Each Section
A strong pitch deck usually follows a predictable structure: problem, solution, market, product, traction, competition, business model, and financials.
Each of these sections benefits from carefully chosen infographics.
For example, the problem slide might use a simple visual to show pain points. The market slide can include charts demonstrating size and growth. Traction slides should display user growth or revenue trends. Competitive analysis can be shown through comparison matrices.
Before designing, identify the single most important message for each section. Avoid the temptation to overload slides with too many graphics.
In 2026, simplicity and focus are far more persuasive than clutter.
Choose the Right Type of Infographic for the Message
Different kinds of information require different visual formats, when it comes to creating clever and eye-catching investor pitch deck infographics that get the message across with minimal effort.
Numbers over time are best shown with line charts. Comparisons between options work well as bar charts. Relationships between components are clearer in diagrams or flowcharts. Processes are easiest to understand when presented step by step.
Selecting the correct format is more important than making a graphic look fancy.
A beautifully designed but poorly chosen chart confuses investors and weakens your argument. A simple, accurate visual builds instant credibility.
Great pitch deck creators think first about communication and only later about aesthetics.
Keep Visuals Clean and Professional
Investor pitch decks are not social media posts. They should feel serious, credible, and professional.
In 2026, overly decorative graphics are considered a distraction. Investors prefer clean lines, neutral colour palettes, and straightforward layouts.
Infographics should match the overall tone of the business. A fintech startup might use precise, minimal visuals. A consumer brand might include slightly more expressive design. But in all cases, professionalism must come first.
Remember that the goal is to inspire confidence, not to impress with artistic flair.
Focus on Readability above Everything
Most pitch decks are reviewed on laptops, tablets, or even smartphones. This means every infographic must be easy to read at small sizes.
Tiny text, complicated tables, and crowded charts are common mistakes that ruin otherwise strong decks.
In 2026, the best practice is to assume that an investor may only glance at each slide for a few seconds. If the main message is not obvious immediately, the infographic needs to be simplified.
Large numbers, clear labels, and strong contrast help ensure that visuals communicate instantly.
Use Data Visualisation Honestly and Ethically
Trust is everything in investor relationships.
It can be tempting to manipulate charts to make numbers look more impressive. Stretching axes, choosing misleading scales, or cherry-picking data may create short-term impact, but experienced investors quickly notice these tricks.
In 2026, transparency is valued more than ever. Infographics must represent data honestly and accurately.
Showing realistic projections, clear assumptions, and truthful comparisons builds far more credibility than exaggerated visuals.
Better to present conservative, believable numbers than flashy but questionable graphics.
Turn Complex Business Models into Simple Diagrams
One of the hardest parts of any pitch is explaining how the business actually works.
Infographics are perfect for this challenge. Flow diagrams can show how customers move through a platform. Revenue models can be explained visually. Technical architectures can be simplified into understandable layers.
Rather than relying on long verbal explanations, use a single clear diagram to make the logic obvious.
In 2026, investors expect founders to communicate complexity in a simple, structured way. Well-designed process infographics demonstrate that ability.
Make Traction Impossible to Ignore
Traction is often the most important part of a pitch deck. It proves that the business is more than just an idea.
Infographics should make traction the star of the presentation.
Growth charts, user numbers, revenue graphs, and milestone timelines should be bold and prominent. These visuals provide concrete evidence that the company is moving in the right direction.
When traction is strong, do not hide it in small tables. Present it confidently with large, clear graphics that demand attention.
In 2026, many successful startups win investment primarily because their traction infographics tell a compelling story.
Present Market Opportunity Visually
Investors care deeply about the size of the opportunity.
Market slides often include complicated research data, but infographics can make this information easy to grasp.
Visuals showing total addressable market, serviceable market, and target segments help investors understand the potential scale of the business quickly.
Maps, charts, and segmented diagrams can all be used to illustrate where growth will come from.
A well-crafted market infographic answers the critical question: “Is this opportunity big enough to matter?”
Use Competitive Analysis Graphics Wisely
Every investor wants to know how a startup compares to alternatives.
Comparison infographics are ideal for showing differentiation. Matrices that map competitors by features, price, or target audience can make advantages obvious without long explanations.
However, these graphics must be fair and balanced. Overly biased comparisons damage credibility.
In 2026, the best competitive infographics acknowledge reality while clearly positioning the startup as unique and valuable.
Make Financial Projections Understandable
Financial slides are often the most intimidating part of a pitch deck.
Investor pitch deck infographics help transform spreadsheets into visuals that investors can follow easily. Revenue projections, cost structures, and break-even points can all be shown through simple charts.
Instead of overwhelming viewers with detailed tables, present the big picture visually and keep detailed numbers for backup materials.
Clarity in financial infographics signals professionalism and preparedness.
Use Consistent Branding and Design Language
Great pitch deck infographics feel like they are part of a coherent whole.
Colours, fonts, icon styles, and layouts should remain consistent from slide to slide. This creates a polished impression and reinforces brand identity.
In 2026, many startups build complete design systems for their pitch decks so that every infographic follows the same visual rules.
Consistency helps investors focus on the message rather than being distracted by changing styles.
Avoid Overloading Slides with Too Much Information
A common problem in pitch decks is trying to fit too many ideas into one infographic.
More information does not equal more persuasion. Often it has the opposite effect.
Each slide should communicate one main point. If you need to show several pieces of data, consider spreading them across multiple slides instead of cramming everything together.
Clean, focused visuals are far more effective than crowded ones.
Design for Live Presentations
Pitch decks are often presented verbally as well as sent digitally.
Infographics should therefore work well on large screens during live pitches. Text must be readable from a distance, and graphics should remain clear when projected.
Avoid overly detailed visuals that require close inspection. Slides should support what the founder is saying rather than compete with it.
In 2026, many founders also prepare simplified versions of infographics specifically for live demos and meetings.
Leverage AI as a Helper, Not a Replacement
Artificial intelligence tools in 2026 can generate charts and layouts quickly. They are useful for drafting ideas and speeding up production.
However, AI should never be trusted blindly for investor materials. Automated visuals often lack strategic thinking and may misrepresent data.
The best results come from using AI to create first drafts and then refining them with human judgement.
Professional oversight remains essential for high-stakes pitch decks.
Test Your Infographics before Pitching
Before presenting to real investors, it is wise to test your visuals.
Show the deck to mentors, advisors, or colleagues and ask them what they understand from each infographic. If they struggle to grasp the message, simplification is needed.
This feedback process helps ensure that graphics communicate clearly under real-world conditions.
Iteration is a key part of creating truly effective investor materials in 2026.
Prepare Backup Visuals for Deeper Discussions
During meetings, investors often ask detailed questions that go beyond the main pitch deck.
It is helpful to prepare additional infographics as backup slides. These might include deeper financial breakdowns, product roadmaps, or technical diagrams.
Having these ready demonstrates professionalism and preparedness without cluttering the main presentation.
Common Mistakes to Avoid
Many pitch decks fail because of predictable infographic errors.
Using tiny fonts, choosing confusing chart types, mixing too many colours, or presenting misleading scales all weaken credibility.
Another frequent mistake is focusing on vanity metrics instead of meaningful business indicators.
Being aware of these pitfalls helps founders create stronger, more persuasive visuals.
Measuring the Effectiveness of Your Infographics
After pitching, pay attention to which visuals generate the most questions and interest.
If investors repeatedly ask for clarification on a certain slide, the infographic may need improvement.
Learning from real interactions allows founders to refine their decks over time and continuously improve communication.
Building a Repeatable Process
Great investor infographics are rarely created in a single attempt.
Successful founders in 2026 develop repeatable processes for designing, testing, and improving their visuals. They treat pitch decks as living documents that evolve alongside the business.
By following clear principles and seeking regular feedback, any startup can steadily improve its investor communication.
Final Thoughts
Creating better investor pitch deck infographics in 2026 is about far more than design skills. It is about understanding investors, clarifying messages, and presenting evidence in the most direct way possible.
When done correctly, infographics transform complex business ideas into simple, persuasive stories. They help founders capture attention, build trust, and guide investors toward confident decisions.
In a competitive funding landscape, clear visual communication is not a luxury. It is a necessity.
Start with strategy, design with purpose, and let your infographics do the heavy lifting in every pitch you deliver.