

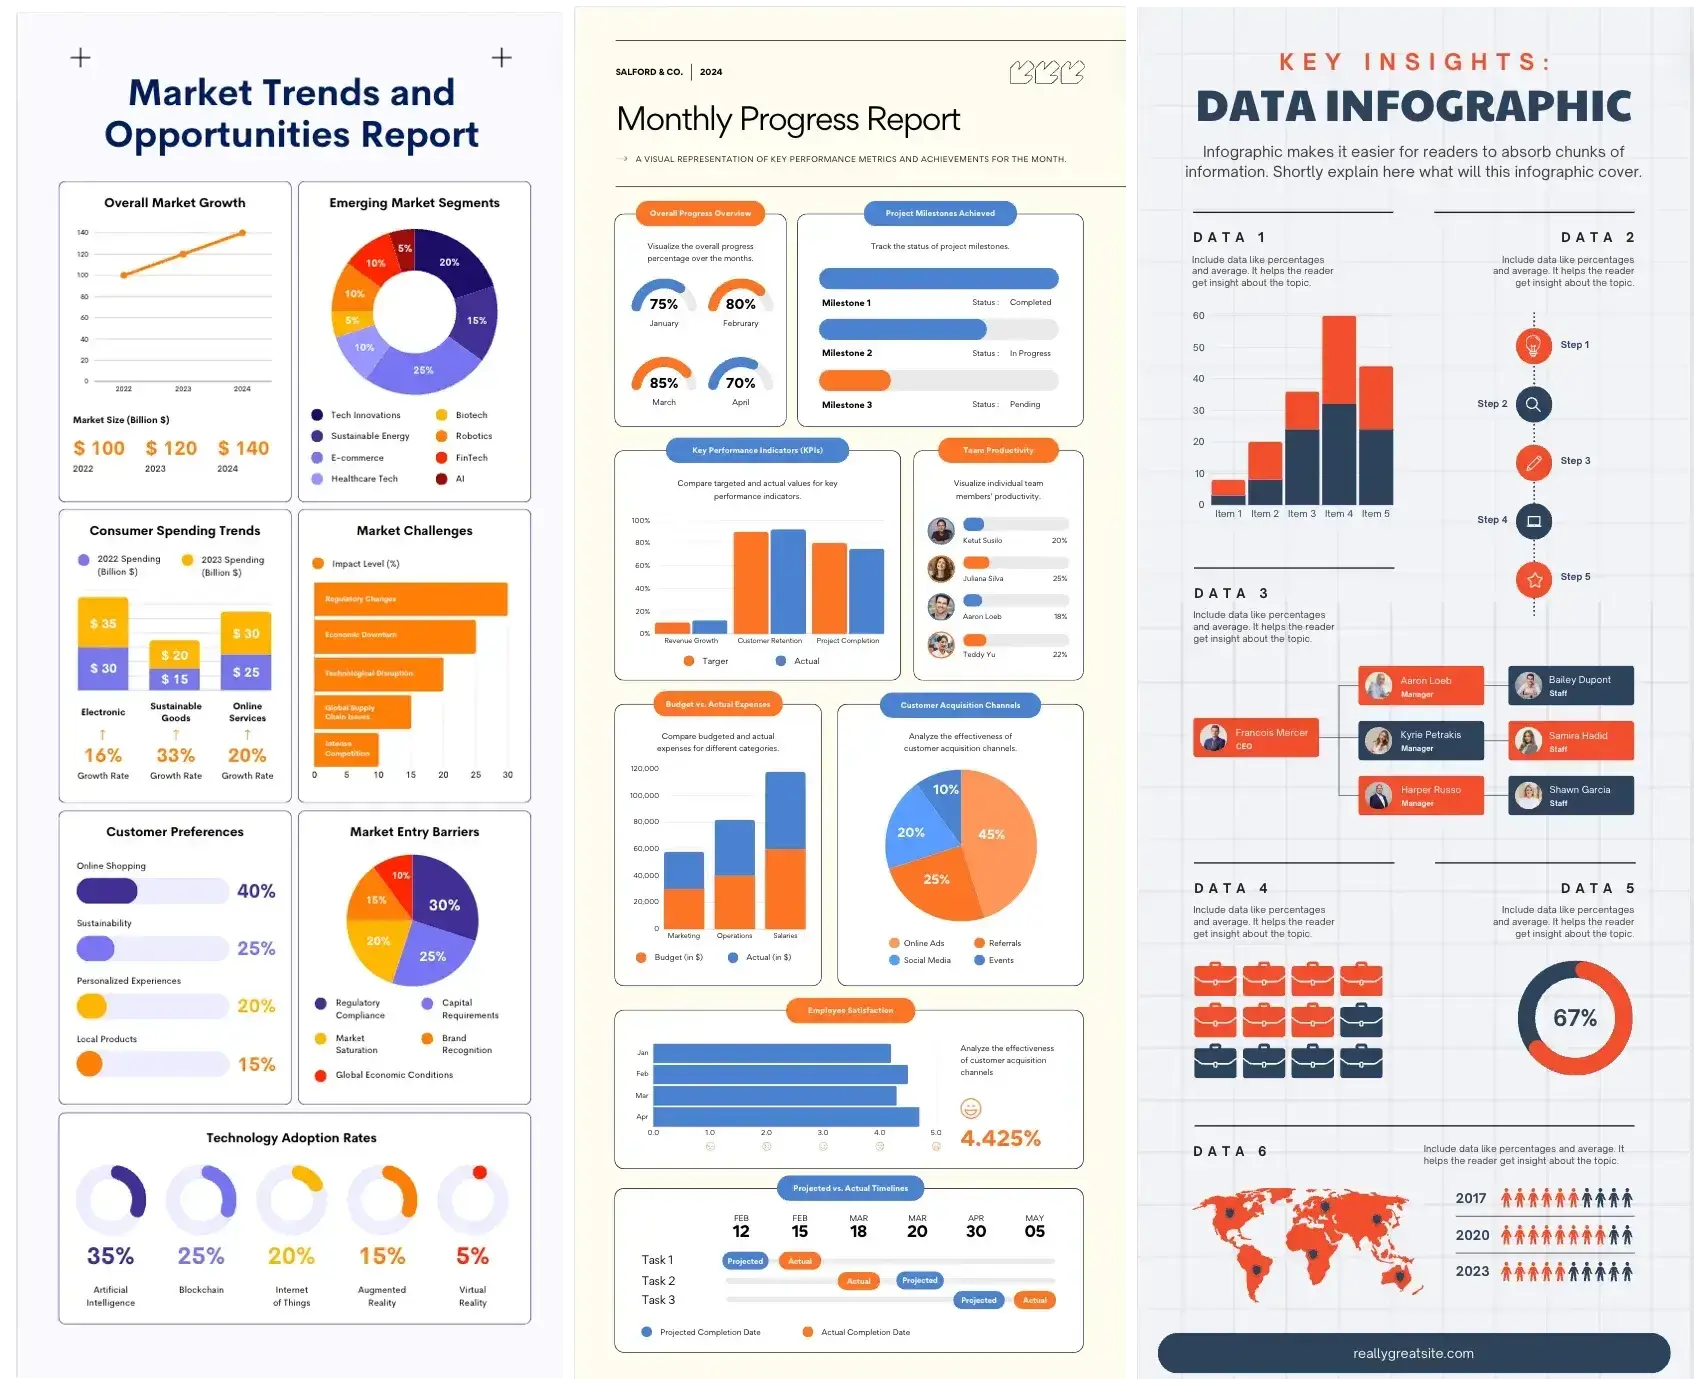
Introduction: Why Year-End Data Is a Goldmine for Visual Content
Every year, businesses generate a massive amount of data. Performance metrics, campaign results, customer insights, financial summaries, operational statistics, and growth indicators are carefully reviewed, documented, and often stored away in reports that few people revisit.
Yet year-end data is one of the most valuable content assets a business owns.
When repurposed strategically, this data can fuel:
- High-performing infographics
- Thought leadership content
- SEO-driven blog posts
- Social media campaigns
- Sales and investor materials
- Internal communications
The problem is not a lack of data—it is a lack of visual storytelling.
This guide explains how to repurpose year-end data infographics into high performing marketing instruments that increase engagement, improve visibility, strengthen authority, and deliver long-term marketing value.
Why Infographics are the Best Format for Year-End Data
Year-end data is often:
- Dense
- Complex
- Multi-layered
- Hard to digest
Infographics excel because they:
- Simplify complexity
- Highlight key insights
- Reduce cognitive load
- Improve retention
- Increase shareability
In busy year-end and holiday periods, decision-makers prefer content that communicates value quickly. Infographics deliver clarity in seconds.
Understanding the Strategic Value of Year-End Infographics
Before repurposing year-end infographic data, it is essential to understand why you are doing it.
The highest-performing infographics meant for the Holiday season typically serve one or more of these goals:
- Building brand authority
- Supporting SEO and organic traffic
- Improving engagement
- Strengthening sales enablement
- Communicating transparency
- Supporting PR and outreach
Clear objectives guide which data to select and how it should be presented.
Identifying the Right Year-End Data to Repurpose
Not all data belongs in an infographic.
The most effective data is:
- Relevant to your audience
- Easy to visualise
- Insightful rather than exhaustive
- Aligned with business goals
High-Value Data Sources
- Annual performance reports
- Marketing analytics
- Customer behaviour insights
- Industry research
- Financial summaries
- Operational milestones
- Product usage statistics
Look for patterns, trends, and standout results—not raw tables.
Define the Core Message before Designing Anything
One of the biggest mistakes businesses make is starting with design instead of message.
Before creating an infographic, ask:
- What is the single most important insight
- Why does this matter to the audience
- What action should this support
High-performing infographics communicate one clear story, not multiple competing messages.
Clarity drives engagement.
Transform Raw Data into a Compelling Narrative
Data alone does not engage—stories do.
Strong infographics follow a narrative structure:
- Context: What this data represents
- Insight: What changed or stood out
- Meaning: Why it matters
- Outcome: What comes next
This storytelling approach turns static data into meaningful content.
Simplify Data without Losing Credibility
One of the most important skills in infographic design is simplification.
Effective infographics:
- Remove unnecessary details
- Focus on key metrics
- Group related data
- Use comparisons sparingly
Simplification does not mean oversimplification. The goal is to make insights accessible without misrepresenting facts.
Choose the Right Infographic Format for Your Data
Different data types work best with different formats.
Common Year-End Infographic Formats
- Timeline infographics for annual progress
- Comparison infographics for year-over-year results
- Statistical infographics for key metrics
- Process infographics for workflows or growth stages
- Map-based infographics for geographic data
Matching format to data improves clarity and impact.
Use Visual Hierarchy to Guide Attention
High-performing infographics are easy to scan.
Visual hierarchy ensures viewers:
- Notice the most important information first
- Understand relationships between data points
- Follow a logical flow
Hierarchy is created through:
- Size
- Colour
- Spacing
- Typography
- Layout
Good hierarchy turns complex data into an intuitive experience.
Maintain Brand Consistency while Highlighting Insights
Year-end infographics should reinforce brand identity.
This includes:
- Brand colours
- Typography
- Tone of voice
- Logo placement
- Visual style
Consistent branding builds recognition and trust—especially when infographics are shared externally.
Focus on Accuracy and Data Integrity
Credibility is non-negotiable.
Ensure:
- Data sources are accurate
- Numbers are up to date
- Scales are not misleading
- Context is clearly explained
High-performing infographics enhance trust rather than risk misinterpretation.
Design for Multi-Channel Repurposing
The most successful infographics are designed for reuse.
A single year-end infographic can be repurposed into:
- Blog visuals
- Social media snippets
- Email graphics
- Sales presentations
- PR assets
- Website banners
Design with flexibility in mind to maximise ROI.
Optimising Infographics for SEO Performance
Infographics support SEO when embedded correctly.
To maximise impact:
- Publish them within long-form content
- Optimise page titles and headings
- Add descriptive alt text
- Include keyword-rich surrounding copy
- Use internal linking
Well-optimised infographic pages attract organic traffic long after year end.
Using Infographics to Attract Backlinks
Infographics are highly linkable assets.
They attract backlinks when they:
- Present unique insights
- Use original data
- Are professionally designed
- Are easy to embed
Outreach to:
- Industry blogs
- Journalists
- Content curators
Backlinks improve authority and search rankings.
Turning Year-End Data into Social Media Content
Social platforms reward visual content.
Repurpose infographic sections into:
- Carousel posts
- Short animations
- Highlight visuals
- Story slides
Each data point becomes a shareable moment.
This extends lifespan and reach.
Supporting Sales and Business Development with Infographics
Sales teams benefit from visual data.
Year-end infographics can:
- Support pitches
- Explain value propositions
- Demonstrate performance
- Build confidence
Clear visuals reduce friction and accelerate decision-making.
Using Infographics for Internal Communications
Infographics are not just for external marketing.
Internally, they help:
- Share performance results
- Align teams
- Celebrate milestones
- Communicate strategy
Visual communication improves clarity and engagement.
Measuring the Performance of Year-End Infographics
Track performance against objectives.
Key metrics include:
- Page views
- Time on page
- Social shares
- Backlinks
- Conversion rates
Use insights to refine future content strategies.
Common Mistakes to Avoid when Repurposing Data
When repurposing year-end data infographics, always look out for the following pitfalls:
- Overloading visuals with data
- Designing without strategy
- Ignoring mobile optimisation
- Using outdated statistics
- Failing to plan distribution
High-performing data infographics for Holiday season marketing are always well-planned before execution, and never rushed based on hunches or projections.
Planning a Sustainable Year-End Infographic Strategy
The most successful brands treat infographics as long-term assets.
Best practices include:
- Annual updates to core visuals
- Reusing formats year after year
- Building a visual content library
This improves efficiency and consistency.
Why Professional Infographic Design Matters
Poor design undermines even the best data.
Professional design:
- Improves clarity
- Enhances credibility
- Increases engagement
- Supports brand positioning
During year-end campaigns, where visibility is high, quality matters more than ever.
Future-Proofing Infographics beyond Year End
Well-designed infographics can:
- Support evergreen content
- Be updated annually
- Serve as case study visuals
This extends their value well beyond seasonal campaigns.
Turning Insight into Authority
When businesses share insights visually, they:
- Lead conversations
- Demonstrate transparency
- Build trust
- Position themselves as experts
Infographics turn internal data into external authority.
Conclusion: Year-End Data becomes Powerful when Visualised
Year-end data is not just a reporting requirement—it is a strategic content asset.
When repurposed into high-performing infographics, it can:
- Increase engagement
- Strengthen SEO
- Build brand authority
- Support sales
- Deliver long-term ROI
The difference between data that gets ignored and data that drives results is how it is presented.
Infographics transform complexity into clarity—and clarity is what wins attention, trust, and action.


