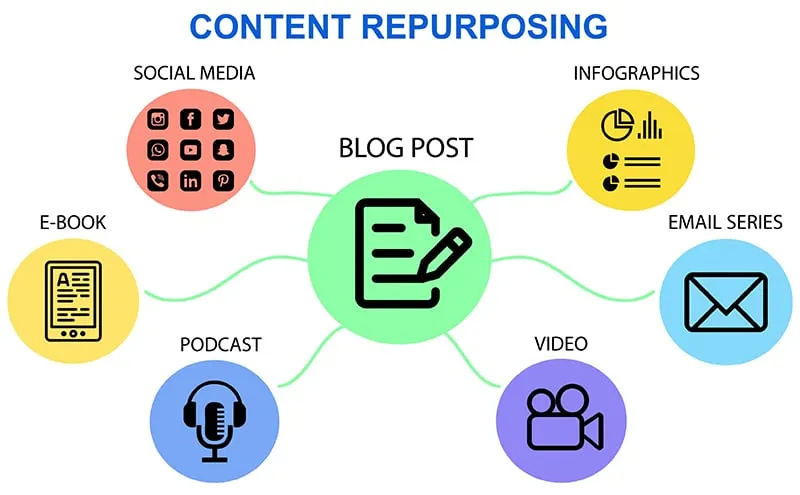
Overview: Why Repurposing Infographics Matters
In today’s fast-paced digital world, businesses are under constant pressure to produce fresh content. But creating high-quality visual assets takes time, creativity, and investment. That’s why for brands to know how to repurpose infographics is such a powerful strategy.
Instead of treating infographics as one-off content pieces, savvy brands are repackaging and adapting them across multiple platforms—extending their lifespan, reaching new audiences, and increasing return on investment (ROI).
Think of it this way: one well-designed infographic can fuel blog articles, LinkedIn carousels, Instagram Reels, email newsletters, and even offline marketing. The key lies in strategic repurposing.
In this guide, we’ll explore why and how to repurpose infographics for maximum impact, with practical examples of adapting designs across platforms without losing their effectiveness.
The Benefits of Repurposing Infographics
Before diving into tactics, let’s explore why repurposing infographics should be part of your content strategy.
a) Maximises ROI
Designing a quality infographic requires research, data analysis, and creative execution. Repurposing ensures you extract every ounce of value from that investment.
b) Reaches Different Audiences
Not everyone consumes content the same way. Some prefer scrolling LinkedIn, others enjoy TikTok or long-form blogs. Repurposing adapts one piece of content for different audience touchpoints.
c) Improves SEO Performance
Infographics repurposed as blog posts, slide decks, or interactive content provide multiple opportunities to rank for related keywords.
d) Keeps Content Fresh Without Reinventing the Wheel
Instead of creating new assets every week, you can refresh, update, and re-publish existing infographic content in different formats.
Core Principles of Repurposing Infographics
To succeed, repurposing isn’t just copying and pasting. It’s about strategic adaptation.
- Break Down Data – Split one infographic into smaller pieces of content.
- Redesign for Platforms – Adjust dimensions, visuals, and copy for Instagram, LinkedIn, or websites.
- Contextualise Content – Tailor the message to fit the platform’s audience expectations.
- Optimise for SEO – Include keywords, alt tags, and backlinks where applicable.
- Track Engagement – Use analytics to measure performance and refine repurposing strategies.
How to Repurpose Infographics for Blogs & Articles
Your blog is one of the best places to extend the life of your infographics.
How to Repurpose:
- Create a blog post around the infographic. Expand on each data point with analysis and context.
- Embed the infographic within the article for visual appeal and SEO value.
- Break down the infographic into multiple posts. For example, an infographic with “10 Marketing Trends” can fuel 10 individual articles.
Example:
If you designed an infographic on “Digital Marketing Stats 2025”, turn it into:
- A blog summarising the infographic.
- A separate article on each trend (SEO, influencer marketing, AI).
- A roundup post linking all related blogs.
Pro Tip: Don’t forget to include the infographic embed code so other sites can share it (generating backlinks).
How to Repurpose Infographics for LinkedIn
LinkedIn thrives on educational and professional content, making it a prime platform for infographic repurposing.
How to Repurpose:
- Carousels/Slides: Split an infographic into individual slides for LinkedIn carousels.
- Single Data Points: Share one impactful stat with commentary.
- Native Documents: Upload parts of the infographic as a downloadable PDF.
Example:
Break an infographic titled “The Future of Remote Work” into a 7-slide LinkedIn carousel, each highlighting a trend (flexible hours, hybrid offices, coworking growth, etc.).
Pro Tip: Add a strong CTA, e.g., “Want the full infographic? Visit our blog.”
How to Repurpose Infographics for Instagram
Instagram is highly visual but has unique format requirements.
How to Repurpose:
- Stories: Crop infographic sections into vertical slides. Add interactive elements like polls or stickers.
- Reels: Animate infographic data into short 15–30 second videos.
- Carousel Posts: Break the infographic into square segments (1080×1080 px).
- Infographic Teasers: Share part of the infographic and direct followers to your site for the full version.
Example:
An infographic on “Healthy Eating Tips” can become:
- Carousel: 8 slides of individual tips.
- Reel: Animated infographic with upbeat music.
- Story: 3–4 highlights with swipe-up to the full blog.
How to Repurpose Infographics for Twitter (X)
Twitter (now X) thrives on quick, bite-sized insights.
How to Repurpose:
- Tweet Stats Individually: Share each stat with a branded graphic.
- Thread Format: Break down the infographic into a 10-tweet thread with images.
- Engagement Polls: Turn infographic data into questions (e.g., “Which of these trends will impact your business most?”).
Pro Tip: Use branded visuals to make your infographic stand out in fast-scrolling feeds.
How to Repurpose Infographics for Facebook
Although Facebook is less visual than Instagram, infographics still perform well.
How to Repurpose:
- Full Infographic Uploads: Share the infographic as a post with a compelling caption.
- Album Breakdown: Post the infographic in segments as an image album.
- Pinned Content: Use top-performing infographics as pinned posts for visibility.
Pro Tip: Boost infographic posts with targeted ads for maximum reach.
How to Repurpose Infographics for Pinterest
Pinterest is a goldmine for evergreen infographic traffic, particularly in lifestyle, business, and education niches.
How to Repurpose:
- Design vertical infographics (735×1102 px or taller).
- Add keyword-rich descriptions for SEO.
- Link directly to your blog for traffic.
Pro Tip: Create multiple pin designs for the same infographic to reach different audiences.
How to Repurpose Infographics for Email Marketing
Emails that include visuals achieve significantly higher engagement.
How to Repurpose:
- Add a snippet of the infographic as a teaser, linking to the full version.
- Use infographics in newsletters to highlight statistics or trends.
- Create exclusive infographics as a value-add for subscribers.
Pro Tip: Keep infographic sections lightweight so they load quickly in inboxes.
How to Repurpose Infographics for Slide Decks & Presentations
Business presentations thrive on visual storytelling. Infographics can be repackaged as PowerPoint slides or PDFs.
How to Repurpose:
- Insert infographic visuals into slide decks.
- Create mini-presentations around infographic themes.
- Offer downloadable PDF slides as lead magnets.
Pro Tip: Tailor corporate infographics into presentation-ready visuals that decision-makers can share internally.
How to Repurpose Infographics for Video Content
Video consumption is skyrocketing, and infographics adapt well into dynamic formats.
How to Repurpose:
- Animated Videos: Turn infographic data into motion graphics.
- Voiceover Explainers: Narrate infographic insights over slides.
- YouTube Shorts/TikTok: Break down infographic tips into 15–60 second clips.
Pro Tip: Add subtitles—80% of people watch videos without sound.
How to Repurpose Infographics for Offline Marketing
Repurposing doesn’t stop online. Infographics also work in print.
How to Repurpose:
- Posters in offices, schools, or events.
- Brochures with infographic-style layouts.
- Trade show banners summarising key statistics.
This creates a multi-channel presence—blending digital with physical branding.
Case Study: One Infographic, 10 Uses
Imagine you create an infographic titled “Top 10 Social Media Trends in 2025”. Here’s how you could repurpose it:
- Blog article featuring the full infographic.
- 10 separate blog posts diving into each trend.
- LinkedIn carousel with each trend on a slide.
- Instagram carousel with visuals.
- Instagram Reel animating the data.
- Twitter thread breaking down the infographic.
- Pinterest pins with vertical formats.
- Email newsletter teaser with link.
- Presentation slides for a webinar.
- Animated video for YouTube Shorts.
That’s 10 different content assets from one infographic.
Tracking & Measuring Success
To maximise value, track how your repurposed infographics perform:
- Website: Use Google Analytics to track referral traffic.
- Social Media: Monitor engagement metrics (shares, saves, clicks).
- Email: Measure open and click-through rates.
- SEO: Track backlink generation and keyword ranking.
Data helps you refine your repurposing strategy for future campaigns.
Conclusion: Making Your Infographics Work Harder
Infographics are powerful storytelling tools, but their real strength lies in adaptability. By repurposing them across blogs, social media, email, video, and even print, you extend their lifespan, increase ROI, and amplify your reach.
The next time you invest in an infographic, don’t stop at one post. Instead, ask: “How can I repackage this across 10 platforms?” With smart repurposing, your visuals will work harder and deliver far greater results.