LinkedIn in 2026 is no longer just a digital résumé platform. It has evolved into one of the most important content channels for professionals, businesses, and thought leaders. Every day, millions of users log in to learn, network, and discover insights that help them grow their careers or companies.
In this environment, infographics have become one of the most effective ways to stand out.
Text posts still have their place, and videos continue to perform well, but infographics hold a unique advantage. They allow complex ideas to be explained quickly. They turn statistics into stories. They help professionals learn something valuable in seconds rather than minutes.
However, not all infographics perform well on LinkedIn.
The platform has its own culture, audience expectations, and algorithmic preferences. An infographic that works beautifully on Instagram or a website may fall flat on LinkedIn if it is not designed specifically for this professional context.
In 2026, success on LinkedIn depends on choosing the right format as much as creating the right message.
This article explores the best infographic formats for LinkedIn today, why they work, and how to use them strategically to build authority, engagement, and real business results.
Why LinkedIn is Perfect for Infographics
Before looking at specific formats, it is important to understand why LinkedIn and infographics are such a strong match.
LinkedIn users come to the platform primarily to gain knowledge. They want industry insights, career advice, leadership lessons, and professional growth tips. They are not looking for entertainment in the same way as on other social networks.
Infographics fit this mindset perfectly.
They provide fast education. They simplify complicated topics. They allow professionals to consume useful information even during short breaks in their day.
In 2026, LinkedIn’s algorithm also rewards posts that keep users engaged longer. Carousel-style infographics and detailed visuals encourage people to pause, swipe, and interact, which boosts organic reach.
For brands and individuals seeking credibility, few content formats are as effective as a well-designed LinkedIn infographic.
Understanding LinkedIn User Behaviour in 2026
To choose the right infographic format, you must first understand how LinkedIn users actually consume content.
Most professionals browse LinkedIn on mobile devices between meetings, on commutes, or during short breaks. They scroll quickly and make instant decisions about whether a post deserves attention.
This means that LinkedIn infographics must be:
- Easy to understand at a glance
- Highly readable on small screens
- Focused on clear takeaways
- Structured for quick scanning
- Professional rather than overly casual
Formats that require heavy reading or complex interpretation rarely perform well.
The best infographic formats in 2026 are those that deliver immediate value without demanding too much time.
The Power of Carousel Infographics
When it comes to the best infographic formats on LinkedIn, the carousel infographic format remains the undisputed leader in 2026.
Carousel posts allow users to swipe through multiple panels within a single post. This format perfectly matches LinkedIn’s educational culture because it turns an infographic into a step-by-step mini-presentation.
Each slide can focus on one idea, statistic, or tip, creating a natural learning journey.
Carousel infographics perform well for several reasons. They increase dwell time as users swipe from panel to panel. They encourage engagement through curiosity. They also feel more interactive than a single static image.
The most successful LinkedIn carousels typically follow a clear structure: a strong opening slide, several informative middle slides, and a final slide with a conclusion or call to action.
In 2026, any serious LinkedIn infographic strategy should begin with carousel formats.
Single-Insight Infographics
While carousels dominate, single-insight infographics are another highly effective format.
These are simple visuals designed to communicate one powerful idea as clearly as possible. They might present a striking statistic, a useful tip, or a memorable quote in an eye-catching way.
On LinkedIn, professionals often scroll quickly. A single-insight infographic can stop that scroll by delivering instant value.
This format works especially well for thought leaders who want to share quick lessons or observations without overwhelming their audience.
In 2026, single-insight graphics are ideal for maintaining a consistent posting schedule between larger carousel posts.
Data Story Infographics
LinkedIn audiences respond particularly well to data-driven content.
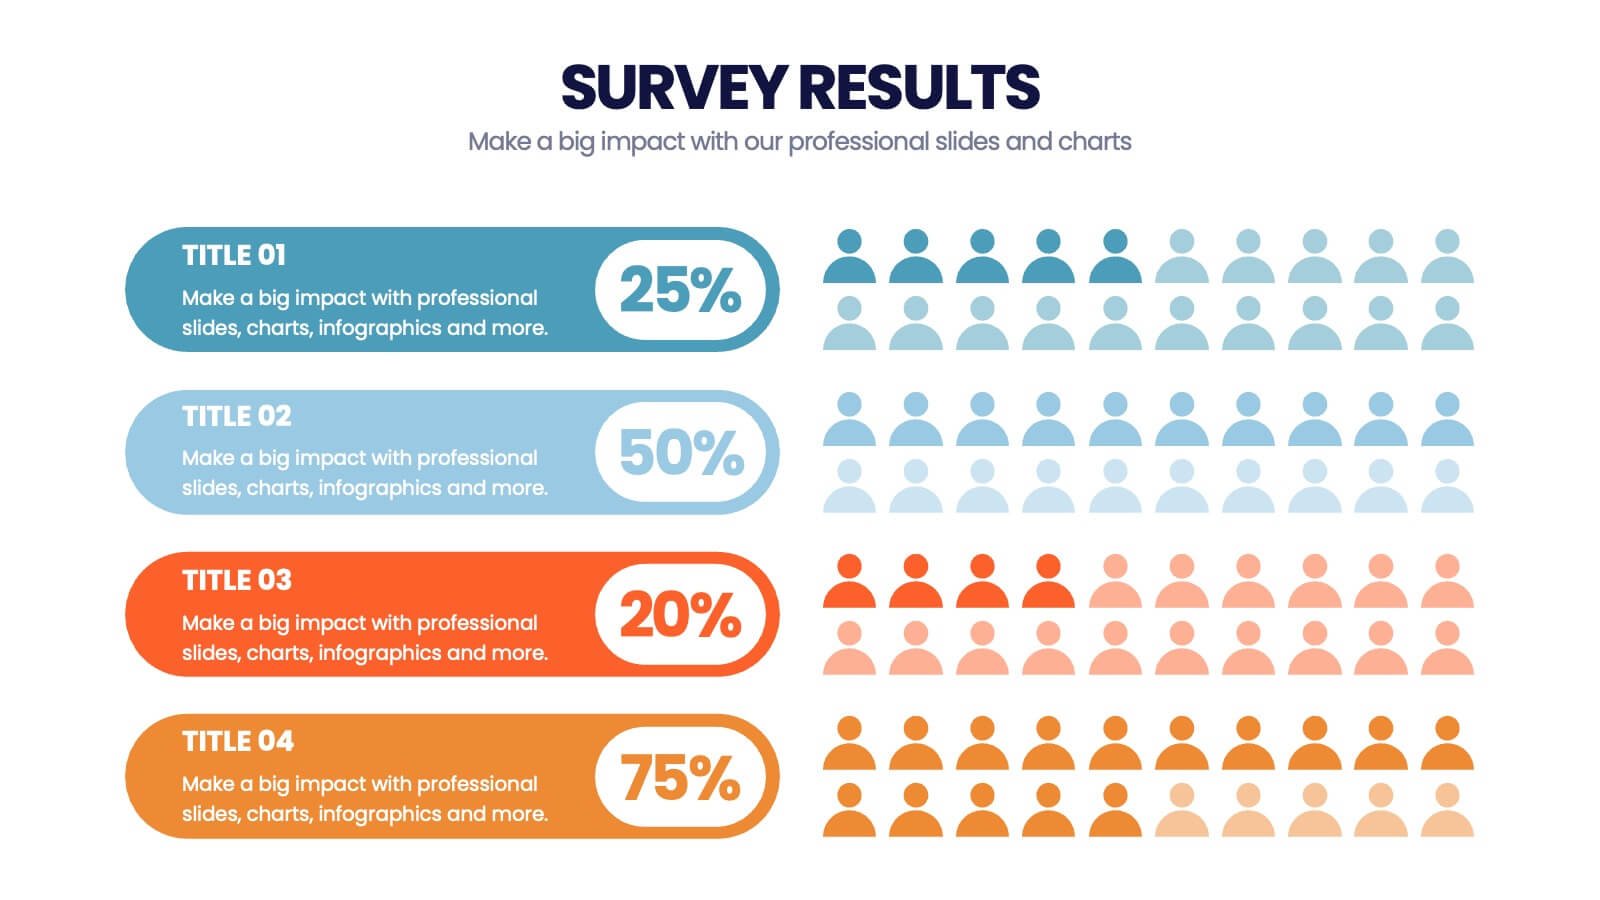
Data story infographics present research findings, industry statistics, or survey results in a structured and professional way. Instead of dumping raw numbers into a post, this format turns data into a clear narrative.
For example, a data story infographic might show how a market has grown over the last five years, what challenges companies face, and what trends are emerging.
These visuals build credibility because they are rooted in evidence rather than opinion.
In 2026, brands that publish original data story infographics on LinkedIn often position themselves as trusted authorities within their industries.
Step-By-Step Guide Infographics
One of the most consistently high-performing formats on LinkedIn is the step-by-step guide.
Professionals love practical advice. Infographics that break processes into simple steps provide immediate, actionable value.
Examples include “How to Prepare for a Job Interview,” “Steps to Improve Team Productivity,” or “A Simple Framework for Strategic Planning.”
This format works especially well as a carousel, with each step presented on its own slide.
In 2026, step-by-step infographics are among the most shareable formats because users feel they are passing along genuinely helpful knowledge to their networks.
Comparison Infographics
Decision-making is a central theme on LinkedIn. Professionals are constantly comparing tools, methods, strategies, and options.
Comparison infographics help simplify those decisions.
These visuals present two or more alternatives side by side, highlighting differences in features, benefits, costs, or outcomes.
On LinkedIn, comparison infographics often spark discussions in the comments as users share their own experiences and preferences.
In 2026, this format is particularly effective for B2B companies that want to position their products or services clearly against competitors.
Framework and Model Infographics
Another format that performs extremely well on LinkedIn is the framework infographic.
These visuals present professional models, systems, or methodologies in a clean, structured way. Examples include leadership frameworks, marketing funnels, project management models, or productivity systems.
Professionals enjoy saving and sharing frameworks because they feel practical and reusable.
A well-designed framework infographic can continue to generate engagement for months as users reference it in their own work.
In 2026, this format remains one of the strongest ways to demonstrate thought leadership on LinkedIn.
Timeline Infographics
Timelines are highly effective on LinkedIn because they help professionals understand progress and change.
Timeline infographics can show the history of an industry, the evolution of a technology, or the milestones of a company.
They are particularly useful for anniversary posts, product launches, or market trend analyses.
This format appeals to LinkedIn users because it provides context and perspective rather than just isolated facts.
In 2026, timeline infographics are widely used by brands to tell their stories in a credible, professional way.
Checklist Infographics
Checklists are simple but powerful and easily one of the best infographic formats for LinkedIn this year.
Professionals often look for quick ways to improve performance or avoid mistakes. Checklist infographics provide exactly that: a concise list of actions or considerations presented visually.
Examples include “Project Launch Checklist,” “Job Application Checklist,” or “Meeting Preparation Checklist.”
On LinkedIn, checklists are frequently saved for later use, which signals strong engagement to the algorithm.
In 2026, this format remains one of the easiest ways to deliver practical value in a small space.
Case Study Infographics
Case study infographics are increasingly popular on LinkedIn because they combine storytelling with proof.
Instead of sharing long written testimonials, brands can present client results in a visual format that highlights challenges, solutions, and outcomes.
This format works particularly well for consultants, agencies, and B2B service providers.
In 2026, professionals are more sceptical of bold claims. Case study infographics provide concrete evidence in a way that feels credible and transparent.
Process Flow Infographics
Many LinkedIn users are interested in improving how they work.
Process flow infographics show how tasks, systems, or workflows operate step by step. They might illustrate recruitment processes, sales funnels, or product development cycles.
These visuals help professionals understand complex operations at a glance.
In 2026, process flow infographics are widely used by companies to explain internal methodologies or educate potential clients about how services are delivered.
Trend Report Infographics
LinkedIn audiences are highly interested in the future.
Trend report infographics summarise key developments within an industry or profession. They might present annual predictions, emerging technologies, or changing consumer behaviours.
These visuals position the creator as forward-thinking and knowledgeable.
Because trends naturally spark conversation, this format often generates high levels of comments and discussion in 2026.
Mistake-Avoidance Infographics
Another format that resonates strongly on LinkedIn is the “what not to do” infographic.
Professionals are often motivated by the desire to avoid errors. Infographics that highlight common mistakes and how to prevent them provide immediate value.
Examples include “Common CV Mistakes,” “Leadership Mistakes to Avoid,” or “Marketing Errors That Hurt ROI.”
This format works well because it taps into real professional anxieties and offers practical solutions.
Best Practices for LinkedIn Infographic Design
No matter which format you choose, certain design principles are essential for LinkedIn success in 2026.
Readability is the most important factor. Text must be large enough to read on a phone screen without zooming. Colours should be professional and consistent. Layouts should be clean and uncluttered.
LinkedIn favours visuals that look educational rather than promotional. Subtle branding works better than heavy logos or sales messages.
Infographics should also be optimised for vertical viewing, since most LinkedIn users scroll on mobile devices.
Design that respects these platform realities consistently outperforms generic graphics.
Writing Captions that Support Infographics
An infographic alone is not enough on LinkedIn.
The caption plays a crucial role in providing context and encouraging engagement. In 2026, the most effective posts combine a strong visual with a thoughtful written introduction.
Captions should explain why the infographic matters, highlight key takeaways, and invite discussion.
Questions at the end of posts often increase comments and interaction, which further boosts visibility.
A strategic combination of visual and text creates the best results.
Using Hashtags and Tagging Strategically
Hashtags remain useful on LinkedIn, but they should be used carefully.
In 2026, best practice is to include a small number of relevant, professional hashtags that relate directly to the topic of the infographic.
Tagging relevant companies or collaborators can also expand reach when done appropriately.
However, overusing hashtags or tagging people unnecessarily can feel spammy and reduce credibility.
Thoughtful distribution tactics amplify even the best infographic formats.
Repurposing Infographics for LinkedIn
One of the smartest strategies in 2026 is repurposing existing content into LinkedIn-friendly formats.
A long website infographic can be broken into a LinkedIn carousel. A research report can be turned into a data story graphic. A presentation slide deck can become a series of educational posts.
Repurposing saves time while maintaining a consistent flow of valuable content.
Brands that treat LinkedIn as part of a broader content ecosystem achieve far better results than those who create visuals only for one platform.
Measuring Success on LinkedIn
To refine your infographic strategy, it is essential to track performance.
Key metrics in 2026 include impressions, engagement rate, saves, comments, shares, and click-throughs.
Carousel swipe rates are especially important because they show how compelling the format is.
By analysing which formats generate the most interaction, you can focus future efforts on what truly resonates with your audience.
Avoiding Common Mistakes
Even the best infographic formats for LinkedIn can fail if executed poorly.
Common mistakes include using tiny fonts, overcrowding slides with text, relying on generic AI-generated visuals, or posting graphics that feel too promotional.
Another frequent error is ignoring the platform’s professional tone. Infographics that look more suited to Instagram or TikTok often underperform on LinkedIn.
In 2026, success comes from respecting LinkedIn’s unique culture and user expectations.
Building a Consistent Posting Strategy
Formats matter, but consistency matters even more.
Publishing high-quality infographics regularly builds recognition and authority over time. Many successful LinkedIn creators follow predictable schedules, such as weekly carousels or monthly data updates.
A planned calendar ensures that infographic content supports long-term goals rather than appearing randomly.
In 2026, LinkedIn rewards creators who show up consistently with valuable, well-designed visuals.
Final Thoughts
LinkedIn in 2026 is a platform built around learning and professional growth. Infographics fit perfectly into that environment when they are created in the right formats.
Carousel explainers, single-insight graphics, data stories, step-by-step guides, comparisons, frameworks, and timelines all have their place depending on your goals.
The key is to choose formats that match LinkedIn user behaviour: clear, mobile-friendly, professional, and immediately valuable.
Brands and individuals who master these infographic formats will continue to build influence, credibility, and meaningful engagement on LinkedIn for years to come.