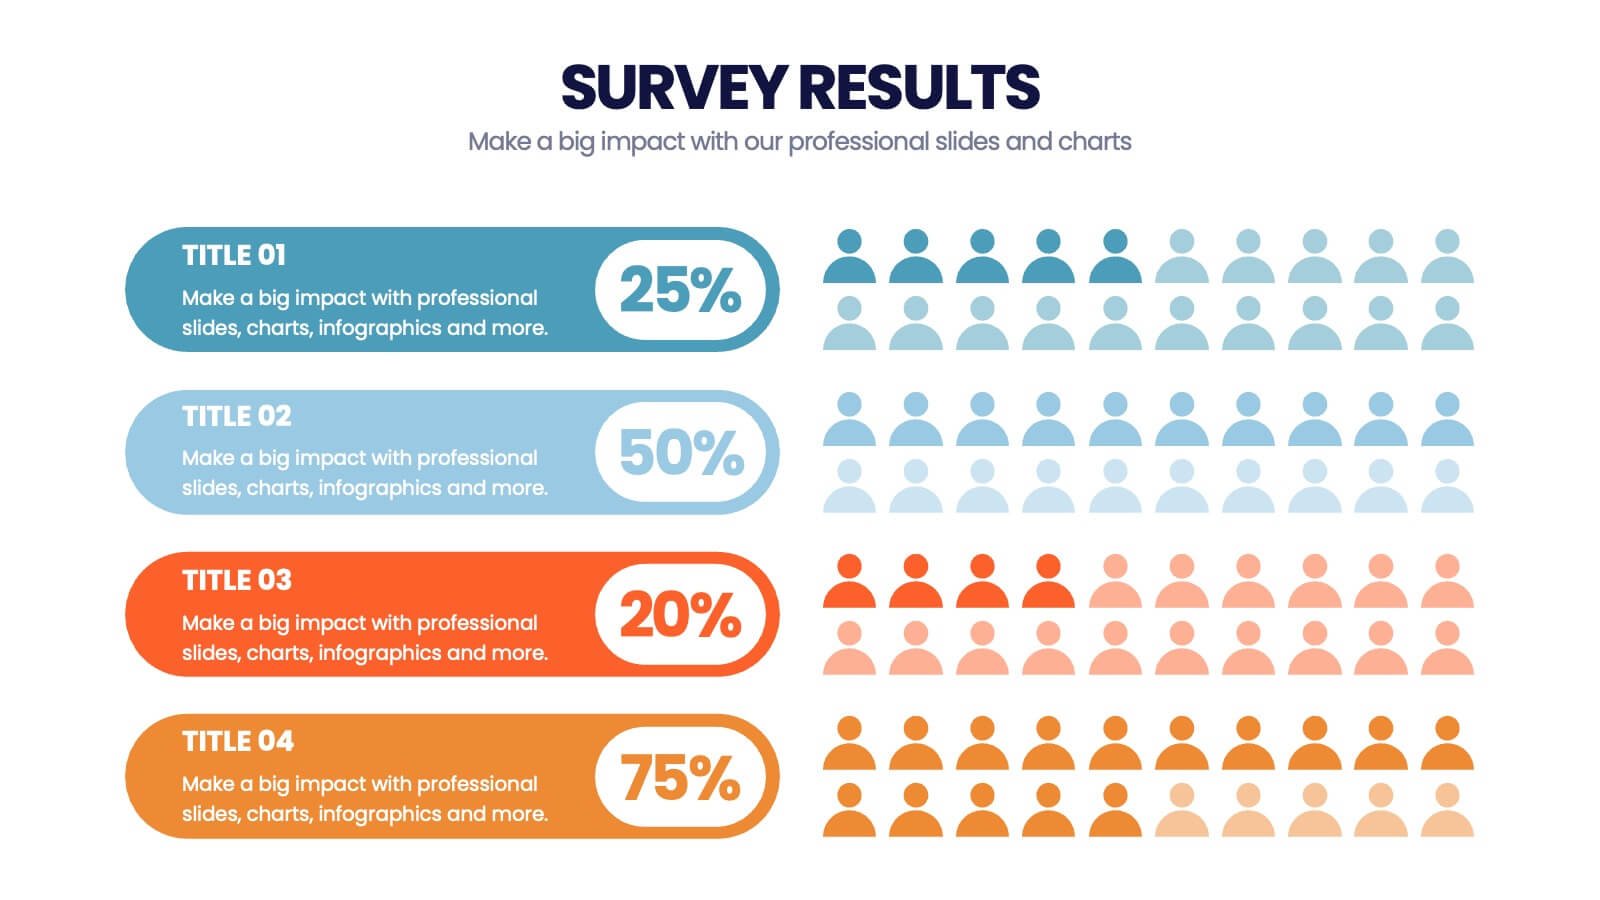
Surveys remain one of the most powerful tools for understanding audiences, measuring opinions, and gathering valuable business insights. Every year, companies, universities, charities, and public organisations collect millions of responses through online forms, customer questionnaires, and market research studies.
Yet collecting survey data is only half the challenge.
In 2026, the real difficulty lies in communicating those results clearly. Raw survey findings are often complicated, dense, and difficult for most people to interpret. Long reports full of percentages and tables rarely capture attention or encourage action.
This is why infographics have become essential for presenting survey results.
Infographics transform spreadsheets of numbers into clear visual stories. They help readers understand key findings quickly, compare opinions easily, and grasp trends at a glance. When done well, they make survey data engaging, memorable, and genuinely useful.
However, turning survey results into effective infographics requires more than simply placing numbers on a colourful chart. It requires strategy, structure, and thoughtful design.
This guide explains exactly how to present survey results using infographics in 2026, from planning and preparation to design and distribution.
Why Survey Results Need Visual Communication
Surveys produce valuable information, but they also create overwhelming amounts of data.
A typical questionnaire might include dozens of questions, multiple answer options, demographic filters, and open-ended comments. When all of this is compiled into a report, the result can be pages of statistics that only dedicated analysts are willing to read.
Most audiences simply do not have the time or patience to process this level of detail.
Infographics solve this problem by highlighting what truly matters. Instead of asking readers to interpret tables themselves, infographics present the most important findings visually and logically.
In 2026, audiences expect information to be fast, clear, and easy to digest. Infographics meet this expectation head on by turning complex survey data into something accessible to everyone, regardless of technical background.
Start with a Clear Objective
The first step in presenting survey results with infographics is not design. It is purpose.
Before creating any visual, you must decide what you want the infographic to achieve. Are you trying to share insights with customers, inform internal teams, support a marketing campaign, or influence public opinion?
Different objectives require different approaches.
For example, an infographic designed to attract media attention might focus on surprising or newsworthy findings. An internal report for executives might emphasise trends and comparisons instead. A customer-facing infographic may highlight satisfaction levels and positive feedback.
In 2026, when you present survey results using infographics, it’ll only be as effective as your ability to build it around a single clear goal. Without that focus, visuals easily become confusing collections of unrelated statistics.
Understand Who Will Read the Results
Just as important as objective is audience.
Survey results can be interpreted in many ways depending on who is reading them. A group of researchers may be comfortable with detailed percentages and methodological notes, while a general audience will need simpler explanations.
Before designing an infographic, ask practical questions about the audience. How familiar are they with the topic? What level of detail will they find useful? What questions are they most likely to care about?
In 2026, audience awareness shapes every aspect of infographic creation: language, complexity, visual style, and even which results are highlighted.
A graphic created for the wrong audience will fail no matter how attractive it looks.
Clean and Organise Survey Data First
One of the most important stages when you present survey results using infographics occurs right before any design work begins.
Survey datasets are rarely ready for visualisation immediately. They often contain incomplete responses, duplicate entries, or confusing formats. Percentages may need to be calculated, categories grouped, and results checked for accuracy.
Attempting to create infographics from messy data leads to misleading or unclear visuals.
Professional communicators in 2026 treat data preparation as a critical part of the process. They review raw responses, verify calculations, and organise information into clear, logical categories.
Only once the data is clean and reliable should design begin.
Identify the Key Findings
Most surveys produce far more information than can fit into a single infographic.
Trying to display everything at once is a common mistake. Instead, the goal should be to identify the most important insights and focus on those.
A helpful approach is to ask: if someone remembered only three things from this survey, what should they be?
These main takeaways become the backbone of the infographic. Secondary findings can support them, but they should never overwhelm the core message.
In 2026, successful survey infographics are selective rather than exhaustive. They guide readers toward what matters most.
Turn Data into a Narrative
Survey results are more compelling when they tell a story.
Rather than presenting isolated percentages, effective infographics guide viewers through a logical sequence. They might begin with overall satisfaction levels, move to specific strengths and weaknesses, and finish with recommendations or next steps.
This narrative approach helps readers understand not only what the numbers say, but what they mean.
For example, instead of simply showing that 72 percent of customers prefer a particular feature, an infographic might explain how preferences have changed over time and what that implies for future decisions.
In 2026, storytelling is one of the most powerful tools for making survey data engaging and memorable.
Choose the Right Type of Visuals
Different survey questions require different visual treatments.
Multiple-choice questions often work well as bar charts or pie charts. Rating scales can be shown through progress bars or scorecards. Demographic breakdowns are usually best displayed as segmented charts or icons. Trends over time benefit from line graphs.
Selecting the correct chart type is essential for clarity.
Using an inappropriate visual format can make simple results feel confusing. For example, using a pie chart for data with many small categories can be far harder to read than a simple bar graph.
In 2026, good survey infographics prioritise clear communication over flashy design.
Keep Percentages Simple and Honest
Survey results are usually expressed in percentages, but percentages can be misleading if not handled carefully.
Rounding numbers, choosing unclear scales, or presenting results without context can distort the message. Responsible infographic design means presenting percentages honestly and transparently.
It is also important to show base sizes where relevant. Knowing that “60 percent agree” is more meaningful when readers understand how many people were surveyed.
In 2026, audiences are more data-literate than ever. Accuracy and integrity build trust.
Group and Simplify where Necessary
Large surveys often include long lists of answer options. Presenting all of these individually can overwhelm viewers.
A useful technique is to group similar responses into broader categories. For example, several positive ratings can be combined into a single “satisfied” group.
This simplification helps readers focus on the big picture rather than getting lost in minor distinctions.
However, simplification must be done carefully to avoid misrepresenting the original data. The goal is clarity, not manipulation.
Design for Fast Understanding
Survey infographics are most effective when they can be understood within seconds.
Clear headlines, large numbers, and strong visual hierarchy help viewers grasp the main message quickly. The most important results should stand out immediately, while supporting details remain secondary.
In 2026, attention spans are short. If an infographic requires long explanations to understand, it is unlikely to succeed.
Good design reduces cognitive effort and makes insight feel effortless.
Prioritise Mobile-Friendly Layouts
Most people now view content on smartphones.
This reality has changed how survey infographics must be designed. Small fonts, dense tables, and wide horizontal charts rarely work well on mobile screens.
Modern infographics use vertical layouts, bold text, and generous spacing so that results remain readable on any device.
Designing with mobile in mind from the start ensures that survey findings reach the widest possible audience.
Use Colour Strategically
Colour plays an important role in presenting survey results.
Used well, colour helps readers distinguish categories, compare groups, and identify key findings. Used poorly, it can create confusion or bias.
In 2026, best practice is to use a limited, consistent colour palette. Important results can be highlighted with stronger colours, while less critical information remains neutral.
Accessibility should also be considered. Graphics must remain clear for people with colour-vision deficiencies.
Thoughtful colour choices improve both beauty and understanding.
Make Comparisons Clear
One of the main reasons people present survey results using infographics is to compare opinions between groups.
Infographics are beyond ideal for showing these comparisons visually. Results can be broken down by age, location, role, or other demographics to reveal meaningful differences.
However, comparisons must be presented carefully to avoid misinterpretation. Scales should be consistent, and differences should be shown in context.
In 2026, comparison visuals are among the most engaging parts of any survey infographic because they answer the natural human question: “How do I compare to others?”
Include Context and Explanations
Numbers alone rarely tell the full story.
Effective survey infographics include brief explanations that help viewers understand what the results mean. Small annotations, captions, or callouts can provide essential context.
For example, a statistic showing declining satisfaction becomes more useful when paired with a note explaining recent changes or challenges.
Providing context ensures that data informs rather than confuses.
Handle Open-Ended Responses Creatively
Many surveys include open-ended questions that produce written comments instead of numerical data.
These responses can be extremely valuable but difficult to visualise. In 2026, designers often use word clouds, quote highlights, or thematic groupings to present qualitative feedback.
Pulling out memorable quotes or summarising common themes helps bring human voices into the infographic.
Combining numbers with real comments makes survey results feel more authentic and relatable.
Show Trends over Time
If a survey has been conducted multiple times, trend data is often the most interesting part.
Line graphs or timeline visuals can show how opinions have changed year by year. These visuals provide perspective and help audiences understand whether results are improving or declining.
In 2026, many organisations use annual survey infographics to demonstrate progress, track performance, and communicate long-term impact.
Add Clear Takeaways
Every survey infographic should end with clear conclusions.
Rather than leaving readers to interpret results themselves, summarise the most important insights in simple language. Highlight what the findings mean and what actions might follow.
These takeaways transform raw data into practical knowledge.
Without them, even well-designed visuals can feel incomplete.
Review for Accuracy and Ethics
Because survey results can influence decisions and opinions, accuracy is essential.
Before publishing an infographic, all numbers, labels, and calculations should be carefully checked. Scales and charts must represent data honestly.
Misleading visuals, even if accidental, can damage credibility.
In 2026, responsible communication is just as important as attractive design.
Distribute Infographics Strategically
Creating a survey infographic is only the beginning.
To maximise impact, results should be shared across multiple channels: websites, social media, email newsletters, presentations, and press releases.
Different versions of the same infographic may be needed for different platforms. A detailed report graphic can be simplified into social media posts or slide decks.
Strategic distribution ensures that survey insights reach the right audiences.
Measure Engagement and Impact
Digital tools in 2026 make it easy to track how people interact with infographics.
Views, shares, time on page, and click-through rates reveal which parts of the survey resonate most strongly. This feedback can guide future surveys and future visual designs.
Treating infographic communication as an ongoing learning process leads to better results over time.
The Role of AI in Survey Infographics
Artificial intelligence now plays an important supporting role in presenting survey data.
AI tools can help summarise responses, generate draft charts, and suggest layout ideas. They speed up technical tasks and allow designers to focus on storytelling.
However, human judgement remains essential for interpreting results and ensuring ethical presentation.
In 2026, the best survey infographics combine AI efficiency with human insight.
Final Thoughts
Surveys provide valuable information, but without clear communication that value can easily be lost.
Infographics offer a powerful way to transform complex survey results into visuals that educate, engage, and inspire action. When planned carefully and designed thoughtfully, they make data accessible to everyone.
By focusing on purpose, audience, clarity, and honesty, organisations in 2026 can turn even the most complicated survey findings into beautiful, meaningful stories.