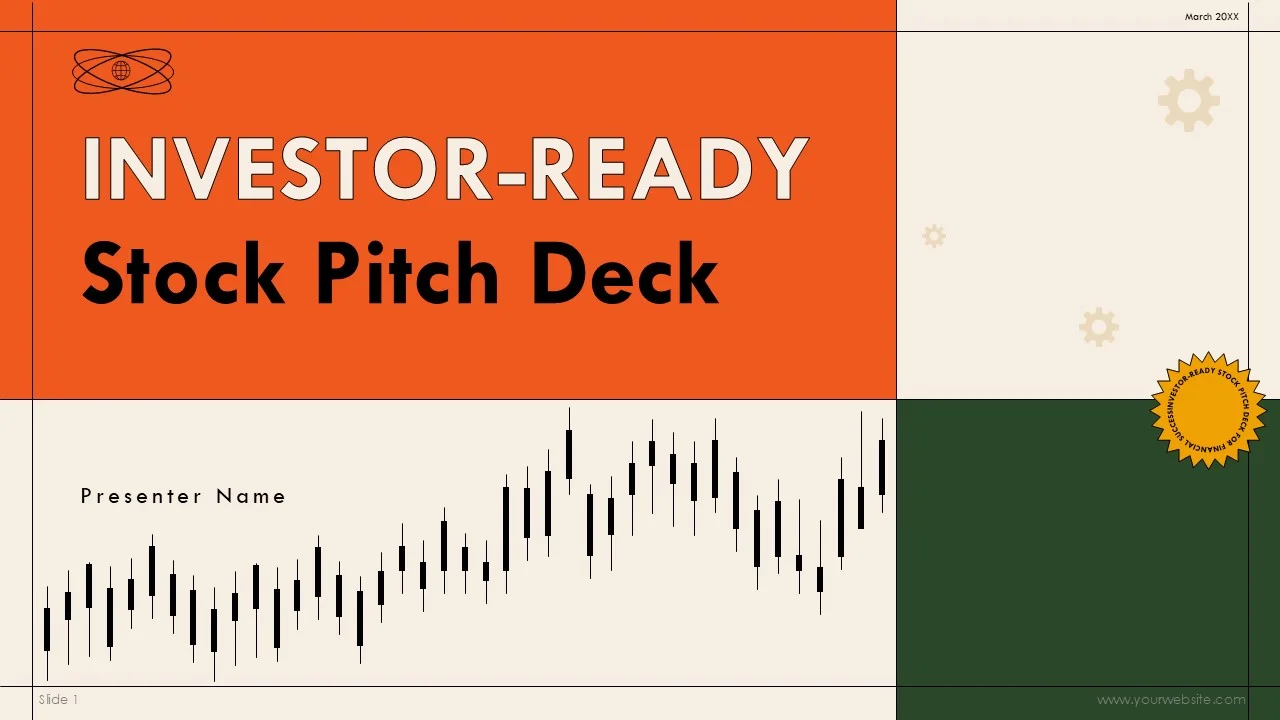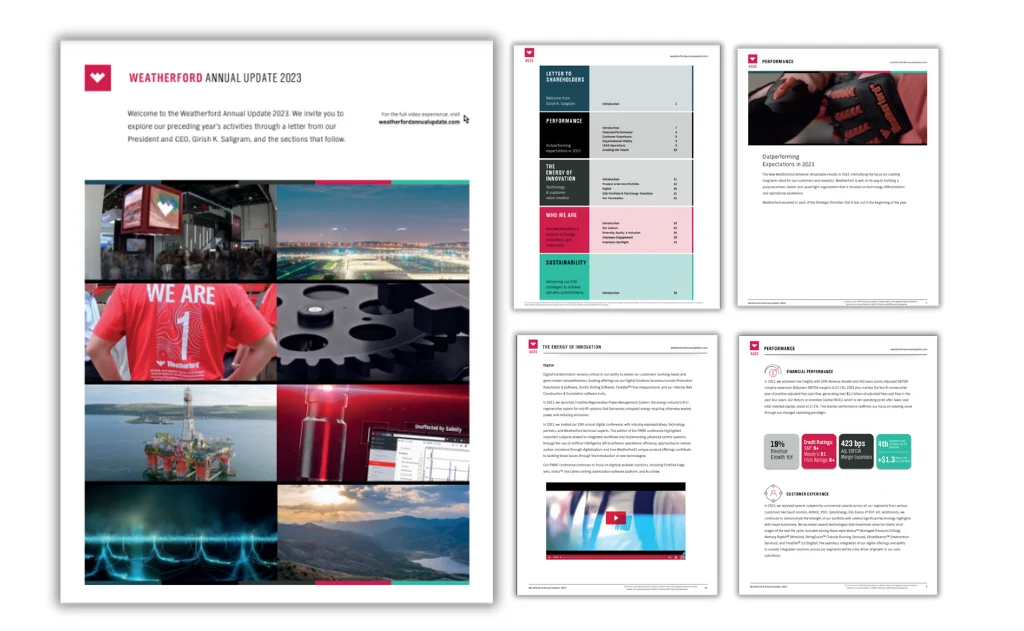
As we continue to see the shift in a largely digital-first world, we are also seeing how businesses have dramatically changed their approach towards producing annual reports in recent years.
What was once a formal, text-heavy document aimed primarily at investors has evolved into a dynamic communication tool used by organisations to tell their story, demonstrate impact, and build trust with a wide range of audiences. In 2026, annual reports are no longer just financial summaries. They are strategic brand assets.
One of the biggest reasons for this transformation is the growing role of infographics.
Infographics have become essential to modern annual report design because they make complex information accessible, engaging, and memorable. Financial data, performance metrics, sustainability achievements, and organisational milestones are all far easier to understand when presented visually.
However, designing infographics for annual reports is very different from creating visuals for social media or blog content. Annual reports carry high expectations for accuracy, professionalism, and clarity. Mistakes or poor design decisions can undermine credibility.
This guide explores how to design infographics for annual reports in 2026, covering strategy, structure, design principles, and best practices that ensure your report communicates with clarity and confidence.
Why Infographics Matter in Annual Reports
Annual reports are packed with information.
They typically include financial results, operational highlights, strategic priorities, risk assessments, sustainability updates, and future outlooks. Presenting all of this in text alone can overwhelm even the most engaged reader.
Infographics help solve this problem.
They transform dense data into clear visual stories. They allow readers to grasp key points quickly without wading through pages of explanation. In 2026, audiences expect information to be easy to digest, even in formal documents.
Infographics also humanise annual reports. Instead of feeling like dry financial statements, reports with strong visual communication feel more approachable and transparent. They reflect an organisation that values clarity and openness.
For companies competing for investor attention, public trust, or stakeholder support, that perception is invaluable.
Understanding the Audience in 2026
Before attempting to understand how to design infographics for annual reports, we must take a step back and essentially understand who will read it.
Modern annual reports have multiple audiences. These include investors, board members, employees, customers, partners, regulators, and the general public. Each group has different interests and levels of financial literacy.
In 2026, the best annual report infographics are designed with layered audiences in mind.
For example, a financial performance infographic must be detailed enough to satisfy analysts while still being clear enough for non-experts to understand. A sustainability infographic should communicate impact without overwhelming readers with technical jargon.
Designing for such diverse audiences requires balance. Infographics must simplify without oversimplifying. They must be engaging without feeling informal.
Audience awareness is the foundation of successful annual report design.
The Unique Challenges of Annual Report Infographics
Designing infographics for annual reports is more complex than creating typical marketing visuals.
Accuracy is critical. Numbers must be precise, sources must be verifiable, and representations must be honest. Unlike promotional graphics, annual report infographics are often subject to legal and regulatory scrutiny.
Consistency is another major challenge. Annual reports usually span dozens of pages. Infographics must fit within a broader visual system that includes charts, tables, photographs, and text layouts.
There is also the issue of longevity. While social media infographics may be used for a few weeks, annual report visuals become part of an organisation’s permanent record. They must remain clear and relevant for years.
In 2026, these constraints make thoughtful design more important than ever.
Starting with Strategy before Design
When it comes to understanding how to design infographics for annual reports, one of the biggest mistakes organisations make is jumping straight into design.
Effective annual report infographics begin with strategy.
Before any visual work begins, teams should clarify what each infographic needs to achieve. Is the goal to highlight growth? Explain a process? Demonstrate impact? Compare performance across years?
Every infographic should answer a specific question for the reader.
In 2026, leading organisations create an infographic plan at the start of the annual report process. This plan maps out which sections require visuals and what story each visual will tell.
Strategic planning prevents clutter and ensures that infographics add real value rather than simply filling space.
Selecting the Right Data to Visualise
Not all information belongs in an infographic.
Annual reports contain enormous amounts of data, but only a portion of it benefits from visual treatment. Choosing what to visualise is one of the most important decisions in the design process.
In general, infographics work best for:
- Trends over time
- Comparisons between categories
- Proportions and distributions
- Processes and workflows
- Geographic information
- Key achievements and milestones
Routine or highly detailed financial tables are often better left as tables. Attempting to turn every figure into a graphic can create confusion.
In 2026, the guiding principle is clarity. Visualise information that becomes easier to understand when seen rather than read.
Building a Clear Narrative Structure
Annual report infographics should not feel like isolated graphics. They should form part of a larger narrative.
Each visual should connect logically to the surrounding text and to other infographics in the report.
For example, a report might begin with a high-level overview infographic showing overall performance. Later sections might include more detailed visuals explaining revenue streams, operational efficiency, or sustainability impact.
This progression mirrors the way readers naturally process information, moving from big picture to detail.
In 2026, the most effective annual reports feel like guided journeys rather than collections of unrelated visuals.
Designing for Trust and Credibility
Trust is the currency of annual reports.
Infographics must therefore prioritise honesty and transparency above all else. Exaggerated charts, misleading scales, or overly decorative visuals can quickly damage credibility.
Design choices should always support accurate interpretation.
Axes should start at logical points. Proportions should be visually truthful. Data sources should be clearly referenced when necessary.
In 2026, readers are more data-literate than ever. They can spot manipulation easily. Ethical design is not just a moral choice but a practical necessity.
Simplicity as a Guiding Principle
Annual reports contain complex information, but infographics should never feel complex.
The goal is to simplify without distorting.
Effective visuals remove unnecessary elements and focus attention on what truly matters. This means avoiding clutter, excessive colours, and overly intricate layouts.
White space is particularly important. In formal documents, breathing room around charts and graphics improves readability and conveys professionalism.
In 2026, simplicity is a mark of confidence. Organisations that communicate clearly appear more credible and well-organised.
Using Brand Identity Thoughtfully
Infographics in annual reports must align closely with brand identity.
This includes consistent use of colours, typography, iconography, and visual style. However, branding should support clarity rather than compete with it.
Overly bold colours or decorative elements can distract from the data itself.
The best approach is to use brand guidelines as a framework while allowing flexibility for readability. For example, brand colours can be applied to highlight key metrics, but neutral tones may be better for secondary information.
In 2026, strong annual reports balance brand expression with professional restraint.
Choosing the Right Types of Visuals
Different kinds of information require different kinds of infographics.
Financial performance is often best shown through clean bar charts, line graphs, and comparison visuals. Operational processes benefit from flowcharts or step-by-step diagrams. Sustainability achievements can be illustrated through impact icons and proportional graphics.
Maps are useful for showing geographic reach. Timelines help present milestones and strategic progress.
Selecting the correct visual format is more important than making the design look impressive.
In 2026, smart format choices are a key indicator of design maturity.
Ensuring Accessibility and Inclusivity
Accessibility has become a central consideration in 2026.
Annual reports are read by diverse audiences, including people with visual impairments or colour-vision deficiencies. Infographics must therefore be designed to be as inclusive as possible.
This means using strong colour contrast, avoiding reliance on colour alone to convey meaning, and ensuring that text within graphics is large and legible.
Alternative text descriptions for digital versions of reports are also essential.
Accessible design is not just about compliance. It ensures that the report communicates effectively to everyone.
Designing for Print and Digital Formats
Most annual reports in 2026 exist in both print and digital forms.
Infographics must work equally well in both environments.
Print versions require high-resolution graphics, careful attention to margins, and consideration of how visuals appear on paper. Digital versions may need interactive elements, responsive layouts, or animated charts.
Designers must plan for these differences from the beginning rather than adapting at the last minute.
The most successful organisations treat their annual report as a multi-platform communication project rather than a single document.
Creating Consistency across the Report
Consistency is essential in annual report design.
All infographics should feel like part of the same visual family. This means using consistent grid systems, icon styles, chart formats, and colour treatments throughout the document.
Randomly styled visuals undermine professionalism and confuse readers.
In 2026, many organisations develop specific infographic style guides for their annual reports to maintain coherence across sections and contributors.
Collaborating with Data and Finance Teams
Designers rarely work alone on annual reports.
Accurate infographics require close collaboration with finance, operations, sustainability, and communications teams. These stakeholders provide the data and context needed to create meaningful visuals.
Clear communication between designers and subject-matter experts is vital to avoid misinterpretation.
In 2026, the best annual reports emerge from true cross-functional teamwork, where designers are involved early rather than brought in at the final stage.
The Role of Storytelling in Data Visualisation
Even in formal documents, storytelling matters.
Infographics should not simply display numbers. They should help tell the story of the year: challenges faced, progress made, goals achieved, and plans for the future.
This narrative approach makes annual reports more engaging and memorable.
For example, instead of listing revenue figures, an infographic might show growth over time, key drivers of success, and comparisons to previous years.
In 2026, data without context is no longer enough. Readers expect interpretation as well as information.
Avoiding Common Design Mistakes
Several recurring mistakes undermine annual report infographics.
Overloading visuals with too much data is one of the most frequent problems. Attempting to show everything at once usually results in confusion.
Another mistake is using overly complex chart types that look impressive but are hard to read.
Poor typography, inconsistent colours, and lack of clear hierarchy also reduce effectiveness.
In 2026, restraint is often the difference between a good infographic and a great one.
Reviewing and Validating Infographics
Because annual reports are official documents, rigorous review processes are essential.
Every infographic should be checked for numerical accuracy, consistency with the written report, and clarity of interpretation.
Small errors can have serious consequences, both reputationally and legally.
Leading organisations in 2026 treat infographic validation with the same seriousness as financial auditing.
Measuring the Success of Infographics
While annual reports are not marketing campaigns, their effectiveness can still be evaluated.
Digital versions allow organisations to track how readers interact with infographics, which pages receive the most attention, and which visuals are shared or referenced most often.
This data helps improve future reports.
In 2026, many organisations view each annual report as part of an ongoing learning process rather than a one-time project.
Integrating Infographics with Broader Communications
Now that we have a fairly good understanding of how to design infographics for annual reports, we should keep in mind that annual report infographics often have value beyond the report itself.
Key visuals can be adapted for investor presentations, websites, social media, and press releases. Designing with this reuse in mind increases return on investment.
Creating flexible, modular graphics makes it easier to repurpose content across channels.
In 2026, smart organisations think of annual report infographics as strategic assets rather than one-off designs.
The Growing Role of Interactive Infographics
Digital annual reports increasingly feature interactive elements.
Interactive infographics allow readers to explore data at different levels of detail, filter information, or view comparisons dynamically.
While print remains important, interactive visuals represent an exciting frontier for 2026 and beyond.
However, interactivity should enhance understanding, not complicate it. The same principles of clarity and simplicity still apply.
Planning for the Future
Designing infographics for annual reports is not just about the current year.
Many organisations aim to create visual systems that can evolve over time, allowing easy comparison between years and maintaining continuity.
Developing reusable templates and consistent structures makes future reporting more efficient and coherent.
In 2026, forward-thinking design saves time and strengthens long-term storytelling.
Final Thoughts
Infographics have become central to effective annual reporting.
They help organisations communicate complex information clearly, build trust with stakeholders, and present achievements in a compelling way.
Designing infographics for annual reports in 2026 requires more than graphic design skills. It demands strategic thinking, data literacy, audience awareness, and a commitment to accuracy.
When created thoughtfully, infographics transform annual reports from dense documents into powerful stories of progress and purpose.