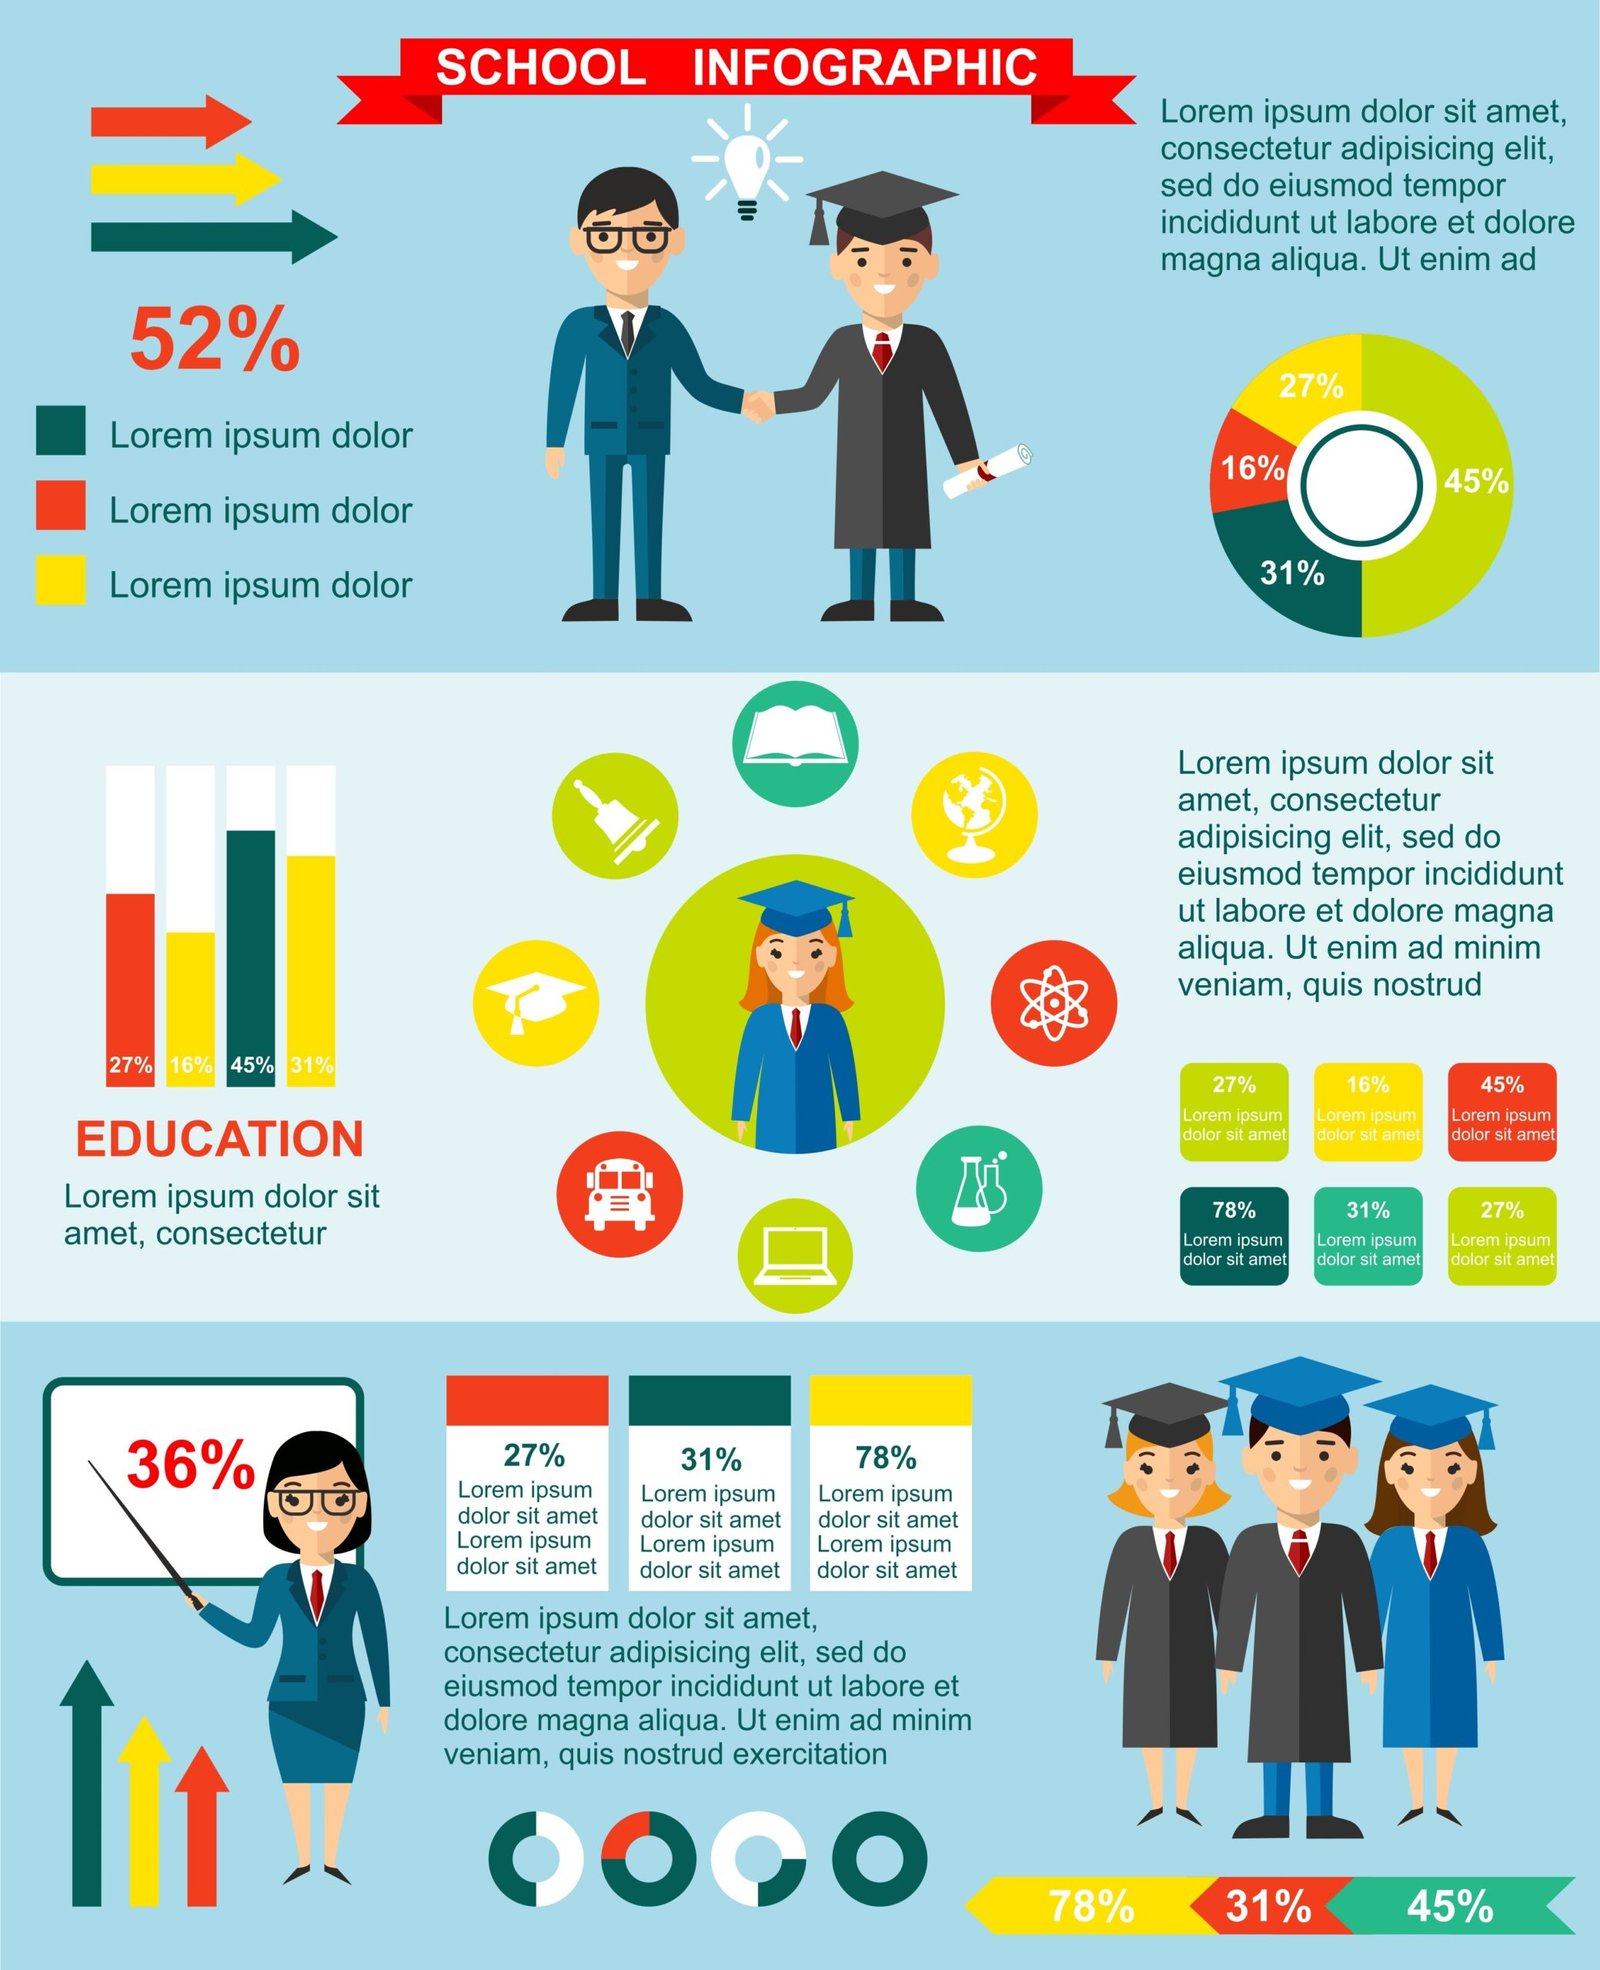
Overview: Content Marketing Meets Visual Storytelling
Infographics and content marketing strategy go hand-in-hand. In fact, they have become the backbone of any smart brand’s digital strategy. While blogs, social media, email campaigns, podcasts, and videos all compete for consumer attention in a crowded digital landscape, the real challenge isn’t just publishing more content—it’s creating content that stands out, engages, and drives measurable ROI.
That’s where infographics come in. Infographics combine data, design, and storytelling into a single powerful visual asset. They simplify complex topics, grab attention, and make content more shareable.
When integrated into a wider content marketing strategy, infographics act as force multipliers—elevating reach, improving SEO, and delivering tangible returns on investment.
This article explores how infographics fit into a content marketing strategy and, crucially, how to measure their ROI to prove their business value.
Why Infographics Belong in Content Marketing
a) They Simplify Complexity
We live in an age of information overload. Consumers are bombarded with data, statistics, and industry jargon. Infographics distil this complexity into easy-to-digest visuals that cut through the noise.
Example: A 2,000-word whitepaper can be condensed into a single infographic highlighting the main insights.
b) They Capture Attention
Humans process visuals 60,000 times faster than text. In a scroll-driven world, visuals get noticed, while text often gets skimmed or ignored.
c) They Are Shareable by Design
Infographics are naturally suited for sharing across platforms. Whether embedded in blogs, posted on LinkedIn, or pinned on Pinterest, they multiply reach.
d) They Position Brands as Thought Leaders
A well-researched, beautifully designed infographic signals authority. It shows that your brand not only understands complex topics but can communicate them clearly.
Infographics in the Content Marketing Funnel
Infographics can play a role at every stage of the customer journey:
a) Awareness Stage
- Infographics grab attention on social media feeds.
- They help potential customers quickly understand industry trends.
- Example: “10 Statistics About Remote Work in 2025”
b) Consideration Stage
- Infographics compare options, outline solutions, or highlight benefits.
- Example: “SEO vs PPC: Which Strategy Delivers Better ROI?”
c) Decision Stage
- Infographics support conversion by demonstrating value propositions.
- Example: A
Overview: Content Marketing Meets Visual Storytelling
Infographics and content marketing strategy go hand-in-hand. In fact, they have become the backbone of any smart brand’s digital strategy. While blogs, social media, email campaigns, podcasts, and videos all compete for consumer attention in a crowded digital landscape, the real challenge isn’t just publishing more content—it’s creating content that stands out, engages, and drives measurable ROI.
That’s where infographics come in. Infographics combine data, design, and storytelling into a single powerful visual asset. They simplify complex topics, grab attention, and make content more shareable.
When integrated into a wider content marketing strategy, infographics act as force multipliers—elevating reach, improving SEO, and delivering tangible returns on investment.
This article explores how infographics fit into a content marketing strategy and, crucially, how to measure their ROI to prove their business value.
Why Infographics Belong in Content Marketing
a) They Simplify Complexity
We live in an age of information overload. Consumers are bombarded with data, statistics, and industry jargon. Infographics distil this complexity into easy-to-digest visuals that cut through the noise.
Example: A 2,000-word whitepaper can be condensed into a single infographic highlighting the main insights.
b) They Capture Attention
Humans process visuals 60,000 times faster than text. In a scroll-driven world, visuals get noticed, while text often gets skimmed or ignored.
c) They Are Shareable by Design
Infographics are naturally suited for sharing across platforms. Whether embedded in blogs, posted on LinkedIn, or pinned on Pinterest, they multiply reach.
d) They Position Brands as Thought Leaders
A well-researched, beautifully designed infographic signals authority. It shows that your brand not only understands complex topics but can communicate them clearly.
Infographics in the Content Marketing Funnel
Infographics can play a role at every stage of the customer journey:
a) Awareness Stage
- Infographics grab attention on social media feeds.
- They help potential customers quickly understand industry trends.
- Example: “10 Statistics About Remote Work in 2025”
b) Consideration Stage
- Infographics compare options, outline solutions, or highlight benefits.
- Example: “SEO vs PPC: Which Strategy Delivers Better ROI?”
c) Decision Stage
- Infographics support conversion by demonstrating value propositions.
- Example: A case study infographic showing how your service increased leads by 300%.
Result: Infographics guide prospects from curiosity to conversion with visual clarity.
Types of Infographics for Content Marketing
Different infographic formats serve different strategic purposes:
- Statistical Infographics: Showcase industry data or survey results.
- Informational Infographics: Educate audiences on trends, methods, or definitions.
- Comparison Infographics: Highlight differences between tools, services, or solutions.
- Timeline Infographics: Show brand history, industry evolution, or project roadmaps.
- Process Infographics: Break down workflows or step-by-step guides.
- Case Study Infographics: Summarise project outcomes with before-and-after data.
Choosing the right type depends on your audience goals and platforms.
Infographics across Content Channels
One of the greatest strengths of infographics and content marketing strategy is their adaptability. They slot into multiple channels, amplifying your content strategy.
a) Blogs & Websites
- Boost engagement with visual storytelling.
- Increase dwell time (good for SEO).
- Encourage backlinks when other sites share your infographic.
b) Social Media
- Instagram & Pinterest: Visual-first platforms thrive on infographics.
- LinkedIn: Carousels and infographic snippets drive B2B engagement.
- Twitter/X: Bite-sized infographic segments fuel threads.
c) Email Marketing
- Infographics summarise newsletters and improve click-through rates.
- Visual teasers encourage readers to click to the full blog or landing page.
d) Paid Ads
- Infographic snippets used in ad creatives often outperform text-heavy designs.
e) Sales Collateral
- Infographics double as leave-behind materials for pitches and proposals.
SEO Value of Infographics
SEO isn’t just about keywords anymore; it’s about content quality and shareability. Infographics deliver SEO benefits in multiple ways:
- Backlink Generation: High-quality infographics are frequently embedded by other sites, creating backlinks.
- Improved Engagement Metrics: Infographics increase dwell time, reducing bounce rates.
- Keyword Integration: Blog posts built around infographics can target long-tail keywords.
- Image Search Optimisation: Infographics can rank in Google Images when tagged correctly.
Tip: Always include an embed code beneath infographics to encourage easy sharing (and backlinks).
Measuring ROI of Infographics
To prove business value, you need to measure the ROI of your infographic campaigns.
Key ROI Metrics:
- Traffic: Did the infographic increase website visits?
- Engagement: How many likes, shares, and comments did it generate?
- Backlinks: How many sites embedded or linked to the infographic?
- Lead Generation: Did it contribute to form fills, newsletter sign-ups, or demo requests?
- Conversions: Did it assist in sales pipeline movement?
- Cost Savings: How much content was generated by repurposing the infographic (blogs, videos, carousels)?
Formula for ROI:
ROI=(Revenue Generated−Cost of Infographic)Cost of Infographic×100ROI = \frac{(Revenue \, Generated – Cost \, of \, Infographic)}{Cost \, of \, Infographic} \times 100=CostofInfographic(RevenueGenerated−CostofInfographic)×100
Example:
- Cost of infographic: £800
- Revenue from campaign influenced by infographic: £4,000
- ROI = 400%
Case Study Example: Infographic ROI in Action
Imagine a SaaS company releasing an infographic on “The Future of Cybersecurity”.
- Published on blog → Increased site traffic by 45%.
- Shared on LinkedIn → Generated 200+ reshares, reaching 50,000 professionals.
- Embedded by 10 industry sites → Created valuable backlinks, boosting domain authority.
- Repurposed as a sales deck → Helped close two enterprise deals.
Outcome: The infographic and content marketing strategy contributed directly to both brand awareness and revenue growth.
Best Practices for Maximising Infographic ROI
a) Invest in Quality Design
Poorly designed visuals won’t get shared. Professional, branded design is essential.
b) Tell a Story
Infographics should have a clear narrative—not just random stats.
c) Promote Strategically
- Share across multiple platforms.
- Use email marketing and influencer outreach.
- Submit to infographic directories.
d) Repurpose Aggressively
Turn one infographic into:
- Blog articles
- LinkedIn carousels
- Instagram Reels
- Animated videos
- Email newsletters
e) Track and Adjust
Monitor performance data and refine future infographics based on results.
The Future of Infographics in Content Marketing
Looking ahead, infographics will continue evolving:
- Interactive Infographics: Clickable charts, hover effects, and data filters.
- Animated Infographics: Motion graphics for social media and YouTube.
- AI-Powered Infographics: Automated data visualisation tools.
- Accessibility Focus: Infographics designed with inclusive colour palettes and alt text.
The future isn’t just about creating infographics—it’s about making them smarter, interactive, and measurable.
Conclusion: Infographics as ROI Engines
Infographics and content marketing strategy combined are strategic assets in modern digital marketing. They simplify complexity, boost SEO, enhance brand authority, and deliver measurable ROI.
When executed well, one infographic can fuel weeks of content across blogs, social media, email campaigns, and sales efforts—multiplying value far beyond the initial investment.
For marketers looking to prove ROI, infographics provide a clear case. They not only attract attention but convert it into tangible business results.
If you want your content marketing to stand out in 2025 and beyond, it’s time to place infographics at the heart of your strategy.
showing how your service increased leads by 300%.
Result: Infographics guide prospects from curiosity to conversion with visual clarity.
Types of Infographics for Content Marketing
Different infographic formats serve different strategic purposes:
- Statistical Infographics: Showcase industry data or survey results.
- Informational Infographics: Educate audiences on trends, methods, or definitions.
- Comparison Infographics: Highlight differences between tools, services, or solutions.
- Timeline Infographics: Show brand history, industry evolution, or project roadmaps.
- Process Infographics: Break down workflows or step-by-step guides.
- Case Study Infographics: Summarise project outcomes with before-and-after data.
Choosing the right type depends on your audience goals and platforms.
Infographics across Content Channels
One of the greatest strengths of infographics and content marketing strategy is their adaptability. They slot into multiple channels, amplifying your content strategy.
a) Blogs & Websites
- Boost engagement with visual storytelling.
- Increase dwell time (good for SEO).
- Encourage backlinks when other sites share your infographic.
b) Social Media
- Instagram & Pinterest: Visual-first platforms thrive on infographics.
- LinkedIn: Carousels and infographic snippets drive B2B engagement.
- Twitter/X: Bite-sized infographic segments fuel threads.
c) Email Marketing
- Infographics summarise newsletters and improve click-through rates.
- Visual teasers encourage readers to click to the full blog or landing page.
d) Paid Ads
- Infographic snippets used in ad creatives often outperform text-heavy designs.
e) Sales Collateral
- Infographics double as leave-behind materials for pitches and proposals.
SEO Value of Infographics
SEO isn’t just about keywords anymore; it’s about content quality and shareability. Infographics deliver SEO benefits in multiple ways:
- Backlink Generation: High-quality infographics are frequently embedded by other sites, creating backlinks.
- Improved Engagement Metrics: Infographics increase dwell time, reducing bounce rates.
- Keyword Integration: Blog posts built around infographics can target long-tail keywords.
- Image Search Optimisation: Infographics can rank in Google Images when tagged correctly.
Tip: Always include an embed code beneath infographics to encourage easy sharing (and backlinks).
Measuring ROI of Infographics
To prove business value, you need to measure the ROI of your infographic campaigns.
Key ROI Metrics:
- Traffic: Did the infographic increase website visits?
- Engagement: How many likes, shares, and comments did it generate?
- Backlinks: How many sites embedded or linked to the infographic?
- Lead Generation: Did it contribute to form fills, newsletter sign-ups, or demo requests?
- Conversions: Did it assist in sales pipeline movement?
- Cost Savings: How much content was generated by repurposing the infographic (blogs, videos, carousels)?
Formula for ROI:
ROI=(Revenue Generated−Cost of Infographic)Cost of Infographic×100ROI = \frac{(Revenue \, Generated – Cost \, of \, Infographic)}{Cost \, of \, Infographic} \times 100=CostofInfographic(RevenueGenerated−CostofInfographic)×100
Example:
- Cost of infographic: £800
- Revenue from campaign influenced by infographic: £4,000
- ROI = 400%
Case Study Example: Infographic ROI in Action
Imagine a SaaS company releasing an infographic on “The Future of Cybersecurity”.
- Published on blog → Increased site traffic by 45%.
- Shared on LinkedIn → Generated 200+ reshares, reaching 50,000 professionals.
- Embedded by 10 industry sites → Created valuable backlinks, boosting domain authority.
- Repurposed as a sales deck → Helped close two enterprise deals.
Outcome: The infographic and content marketing strategy contributed directly to both brand awareness and revenue growth.
Best Practices for Maximising Infographic ROI
a) Invest in Quality Design
Poorly designed visuals won’t get shared. Professional, branded design is essential.
b) Tell a Story
Infographics should have a clear narrative—not just random stats.
c) Promote Strategically
- Share across multiple platforms.
- Use email marketing and influencer outreach.
- Submit to infographic directories.
d) Repurpose Aggressively
Turn one infographic into:
- Blog articles
- LinkedIn carousels
- Instagram Reels
- Animated videos
- Email newsletters
e) Track and Adjust
Monitor performance data and refine future infographics based on results.
The Future of Infographics in Content Marketing
Looking ahead, infographics will continue evolving:
- Interactive Infographics: Clickable charts, hover effects, and data filters.
- Animated Infographics: Motion graphics for social media and YouTube.
- AI-Powered Infographics: Automated data visualisation tools.
- Accessibility Focus: Infographics designed with inclusive colour palettes and alt text.
The future isn’t just about creating infographics—it’s about making them smarter, interactive, and measurable.
Conclusion: Infographics as ROI Engines
Infographics and content marketing strategy combined are strategic assets in modern digital marketing. They simplify complexity, boost SEO, enhance brand authority, and deliver measurable ROI.
When executed well, one infographic can fuel weeks of content across blogs, social media, email campaigns, and sales efforts—multiplying value far beyond the initial investment.
For marketers looking to prove ROI, infographics provide a clear case. They not only attract attention but convert it into tangible business results.
If you want your content marketing to stand out in 2025 and beyond, it’s time to place infographics at the heart of your strategy.