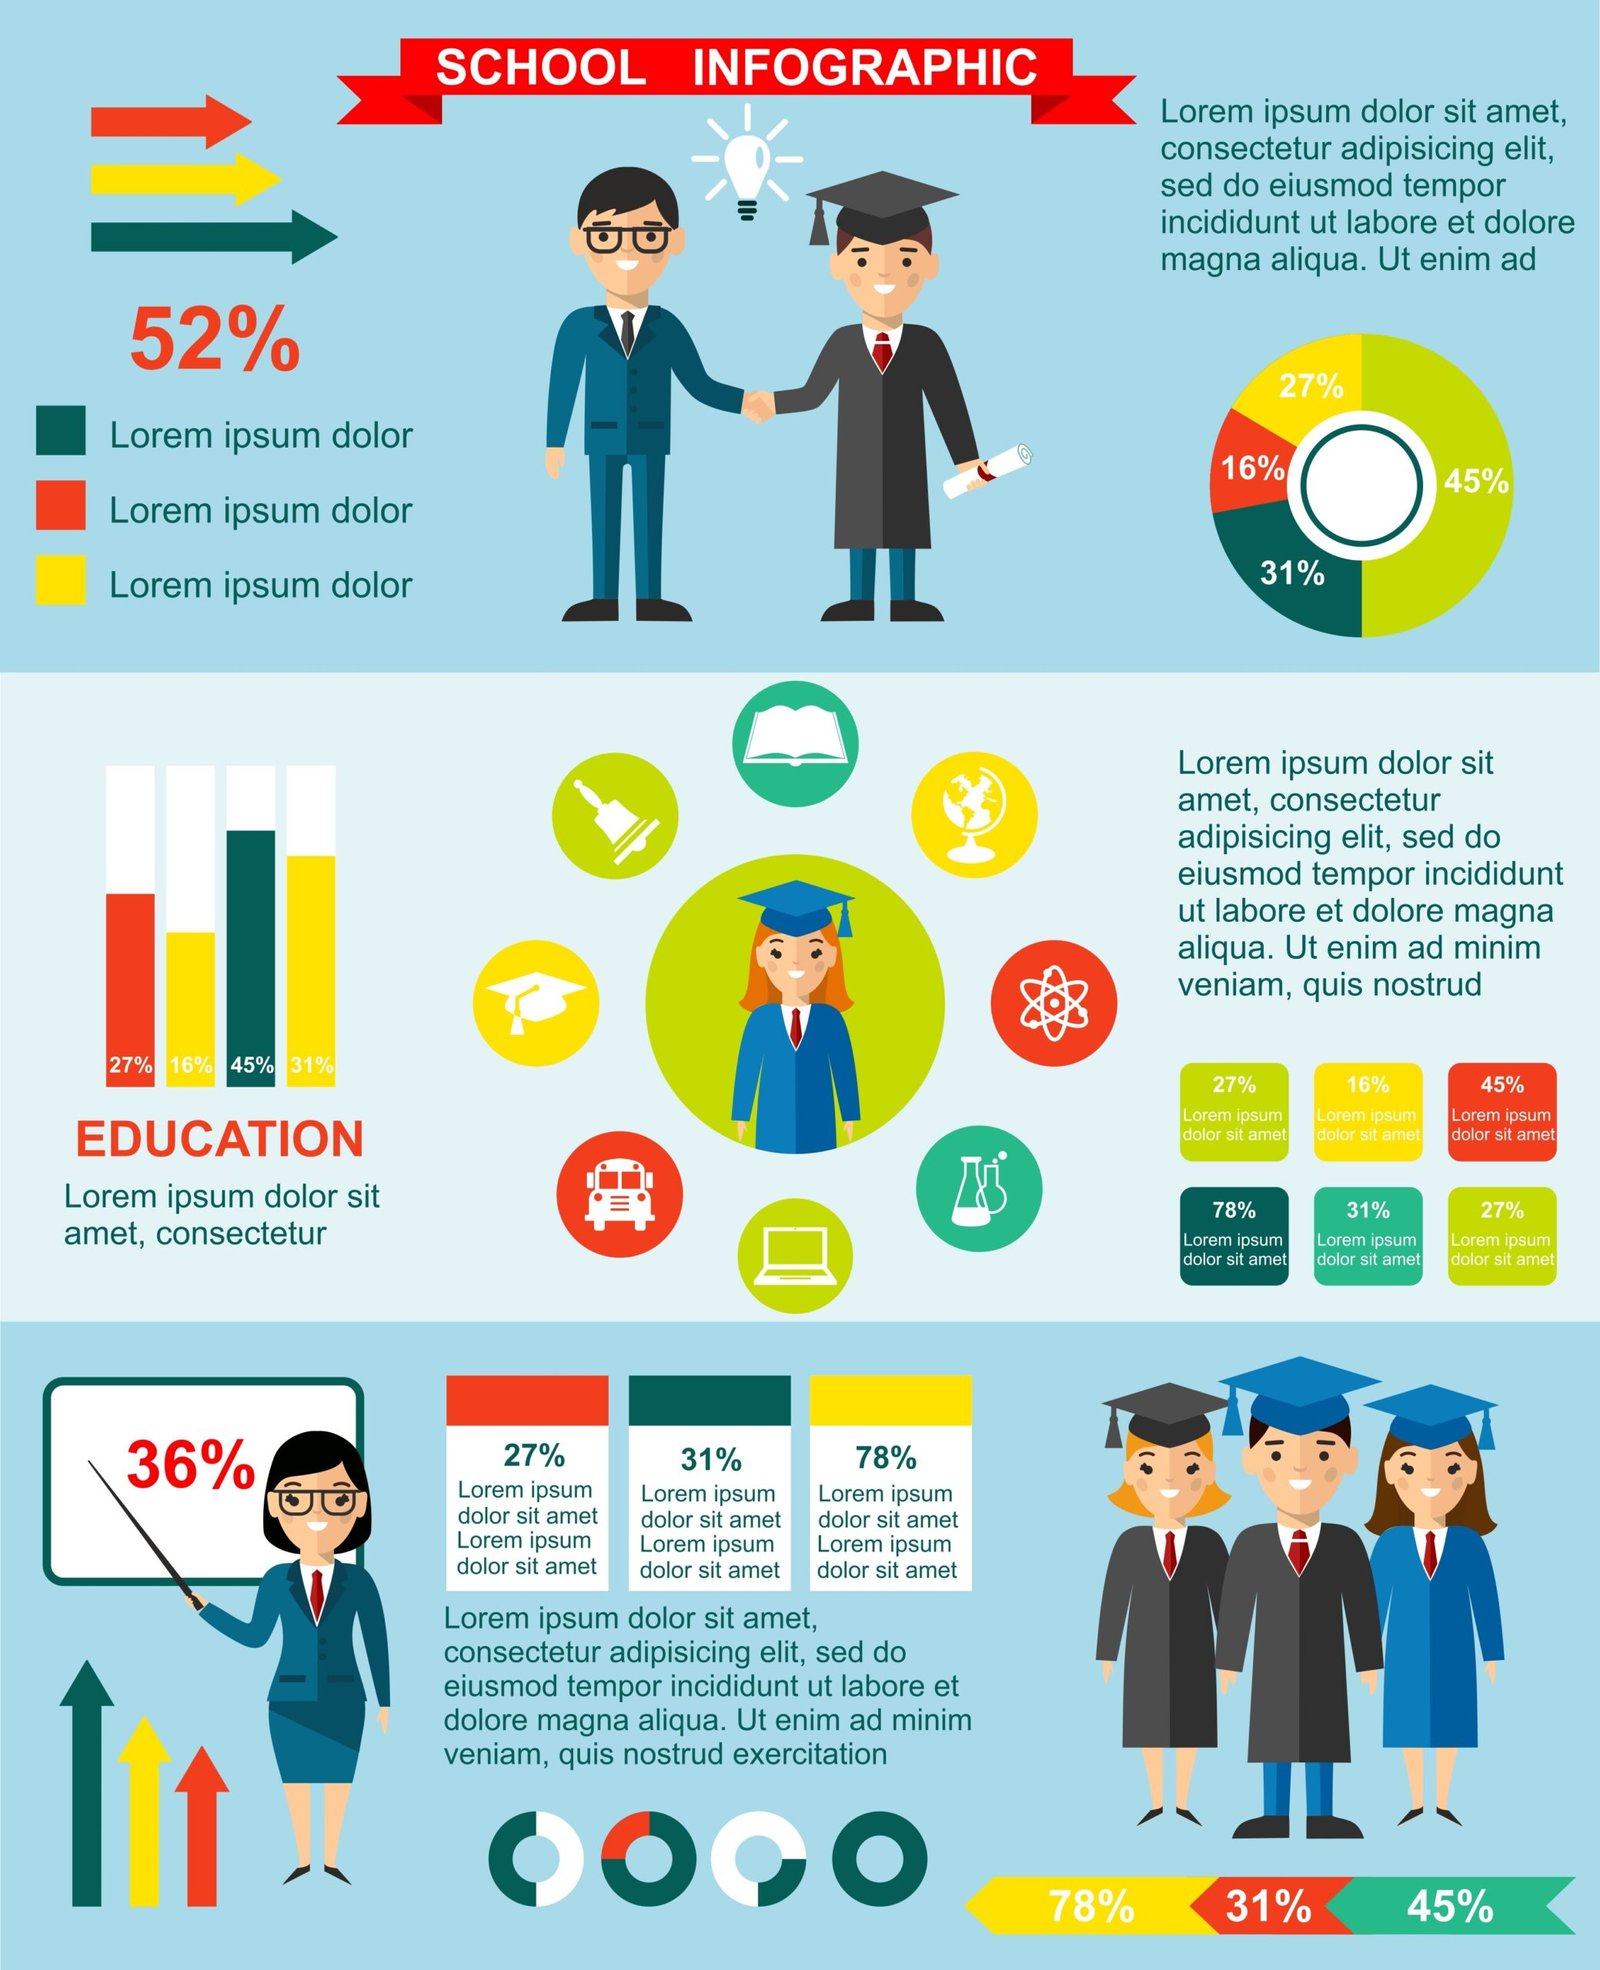
Education has always been about communication—turning complex ideas into lessons learners can understand and remember. From blackboards to interactive apps, every innovation in teaching has revolved around one question: how do we make information easier to grasp?
In 2026, the answer will increasingly lie in infographics. Whether in classrooms, e-learning platforms, or corporate training sessions, infographics offer a fast, engaging way to showcase essential knowledge. They condense pages of text into clear, visual summaries that support comprehension, retention, and recall.
This blog explores how infographics in education, how they are revolutionising the industry, why they work, practical ways to use them, and tips for designing educational infographics that truly empower learners as well as academic institutions.
Why Infographics Work in Education
The Cognitive Science
Research shows that people process visuals 60,000 times faster than text. We also retain 65% of visual information three days later, compared to only 10% of spoken information. For educators, that means visuals can dramatically boost long-term understanding.
Overcoming Information Overload
Students today are bombarded with data—syllabus notes, digital resources, social media streams. Infographics cut through this noise by distilling the key information learners need to know.
Universal Accessibility
Visuals transcend language barriers. Infographics can communicate across diverse classrooms where learners may not all share the same reading level or first language.
Benefits of Infographics in Education
- Simplification of Complex Topics
Infographics break down processes, hierarchies, and relationships into digestible visuals. - Enhanced Engagement
Colourful, creative visuals capture student attention better than walls of text. - Memory Retention
Students recall visualised facts more effectively, aiding exam preparation and long-term understanding. - Inclusivity
Supports diverse learning styles: visual, textual, and kinesthetic learners. - Motivation
Well-designed visuals make subjects feel less intimidating—especially maths, science, or finance. - Assessment and Feedback
Students themselves can create infographics, encouraging active learning and demonstrating comprehension.
7 Types of Infographics in Education
1. Process Infographics
- Illustrate scientific experiments, problem-solving steps, or grammar rules.
- Example: “How Photosynthesis Works” broken into light-dependent and light-independent stages.
2. Timeline Infographics
- Show historical events, author biographies, or project milestones.
- Example: “The Evolution of Computing: 1940–2026.”
3. Comparison Infographics
- Compare theories, formulas, or perspectives side by side.
- Example: Keynesian vs. Classical Economics.
4. Statistical Infographics
- Present survey results, school performance data, or global trends.
- Example: “Global Literacy Rates Over the Last 50 Years.”
5. Map Infographics
- Visualise geography lessons, migration routes, or trade flows.
- Example: “The Silk Road Trade Map.”
6. Anatomy & Breakdown Infographics
- Label parts of an object, system, or concept.
- Example: “Anatomy of a Shakespearean Sonnet.”
7. Mind-Map Style Infographics
- Great for brainstorming or revising interrelated concepts.
- Example: “Causes of World War I.”
6 Clever Applications of Infographics in Education
1. Lesson Introductions
Kick off a new topic with a summary infographic to provide learners a roadmap of what they’ll study.
2. Revision Guides
Instead of 30-page booklets, distribute infographic cheat sheets covering key formulas, definitions, or case studies.
3. Assignments & Projects
Ask students to create their own infographics—demonstrating understanding while building digital literacy.
4. E-Learning Modules
Infographics integrate seamlessly into SCORM packages, online quizzes, and video-based learning.
5. Corporate Training
Annual compliance training (e.g., GDPR, safety rules) can be condensed into engaging one-page visuals.
6. Reports & Dashboards
Education boards can present institutional data (graduation rates, attendance) more clearly through infographics.
Case Studies: Infographics in Action
Case Study 1: Secondary School Science Department
Teachers redesigned physics revision notes into infographic posters. Students reported 25% better recall in mock exams, especially with formula-heavy topics.
Case Study 2: University of London E-Learning Platform
Infographics were embedded in online MBA courses. Feedback showed higher engagement and course completion rates when visuals supported long-form lectures.
Case Study 3: Corporate Training in a London Law Firm
Annual compliance training was redesigned into infographic-based modules. Time spent per learner reduced by 40% while knowledge assessment scores increased.
Tips for Designing Effective Educational Infographics
To truly benefit from infographics in education, keep the following design best practices on-hand:
Tip 1: Start With the Learning Objective
Ask: what should learners remember after this infographic? Build the design around one key takeaway.
Tip 2: Keep It Simple
Avoid overloading visuals with too much data. Less is more when communicating to busy learners.
Tip 3: Use Hierarchy
Headings, colour coding, and font sizes should clearly guide the learner’s eye.
Tip 4: Ensure Accuracy
Cross-check data and facts. Educational infographics must maintain credibility.
Tip 5: Apply Inclusive Design
- High-contrast colours for visibility.
- Alt-text for digital accessibility.
- Avoid cultural bias in imagery.
Tip 6: Make It Shareable
Design formats optimised for print, PowerPoint slides, and social media.
Tip 7: Test With Learners
Pilot your infographic with a small group of students before full rollout.
Tools for Creating Educational Infographics
- Canva Education – User-friendly, template-rich, ideal for teachers.
- Piktochart – Great for data-driven designs.
- Venngage – Focused on professional and academic infographics.
- Adobe Illustrator – Advanced custom design for professional-grade visuals.
- Figma / FigJam – Collaborative creation for classroom projects.
- AI-Assisted Tools – Canva AI or ChatGPT for idea generation and text drafting.
The Role of Infographics in Hybrid and Online Learning
With online education booming post-pandemic, infographics bridge the gap between attention fatigue and meaningful learning. They:
- Fit perfectly into microlearning modules.
- Provide visual relief during long video calls.
- Summarise entire lectures for asynchronous learners.
For London-based universities and corporate training providers, infographics are not just enhancements—they’re competitive differentiators.
Infographic Design Challenges and How to Overcome Them
Challenge 1: Overuse of Style over Substance
Solution: Prioritise content accuracy before design flair.
Challenge 2: Time Constraints for Teachers
Solution: Use ready-made templates or AI-assisted design tools to cut development time.
Challenge 3: Ensuring Accessibility
Solution: Test with screen readers and use accessibility checkers.
Challenge 4: Student Over-Reliance
Solution: Encourage learners to use infographics as supplements, not substitutes for deeper study.
The Future of Infographics in Education
By 2026 and beyond, expect:
- Interactive Infographics: Click-to-expand charts in e-textbooks.
- Personalised Learning: AI tools customising visuals based on student progress.
- Gamification: Infographics embedded in quizzes and challenges.
- Virtual & Augmented Reality: Immersive infographic experiences—imagine anatomy visuals layered over VR headsets.
Education will increasingly blend data, visuals, and interactivity, with infographics at the heart of it.
Practical Checklist for Educators
Here’s a practical checklist to help educators benefit holistically from infographics in education:
- Identify key lesson concepts.
- Choose an infographic type (timeline, comparison, map, process).
- Draft concise copy (avoid text overload).
- Select brand-aligned colours and fonts.
- Add icons or illustrations for clarity.
- Review accuracy with subject experts.
- Test accessibility features.
- Share in multiple formats (PDF, poster, slide, web).
Conclusion: Edge Ahead With Infographics
In education, success isn’t just about delivering content—it’s about ensuring learners understand, remember, and apply knowledge. Infographics empower educators to achieve all three, transforming lessons into memorable experiences.
From classrooms in London to global online platforms, clever use of infographics helps teachers, trainers, and organisations edge ahead by showcasing key information quickly and effectively.
For educators, the message is clear: don’t just teach with words—teach with visuals.
At Infographics Designers, we specialise in designing educational infographics that are accurate, engaging, and tailored to your learners’ needs. Whether you’re creating classroom resources, e-learning content, or corporate training materials, our designs help information stick.