In today’s fast-paced digital landscape with constantly dwindling attention spans, capturing your audience’s attention has become more challenging than ever.
If not for the shrinking attention spans, then the oversaturated feeds and an increasing demand for instant understanding, have made it increasingly difficult for brands and businesses who are searching for smarter, more cost-effective ways to communicate.
Ah, but there is a hack: infographics, which continue to shine, even in 2025.
Despite the rise of AI-generated content, short-form video, and voice search, infographics remain one of the most powerful tools in digital marketing, education, and data communication.
Have you wondered they still work so effectively and what makes them such a compelling marketing tool? In this in-depth article, we explore the data-backed reasons infographics continue to dominate and deliver results—and how to leverage them effectively in your 2025 content strategy.
Infographic in 2025 – How modern infographics have changed
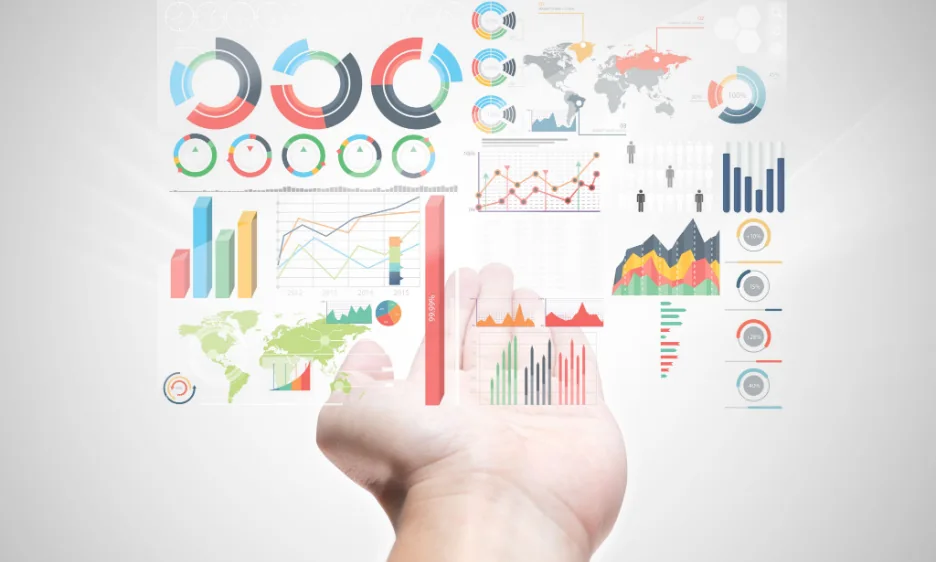
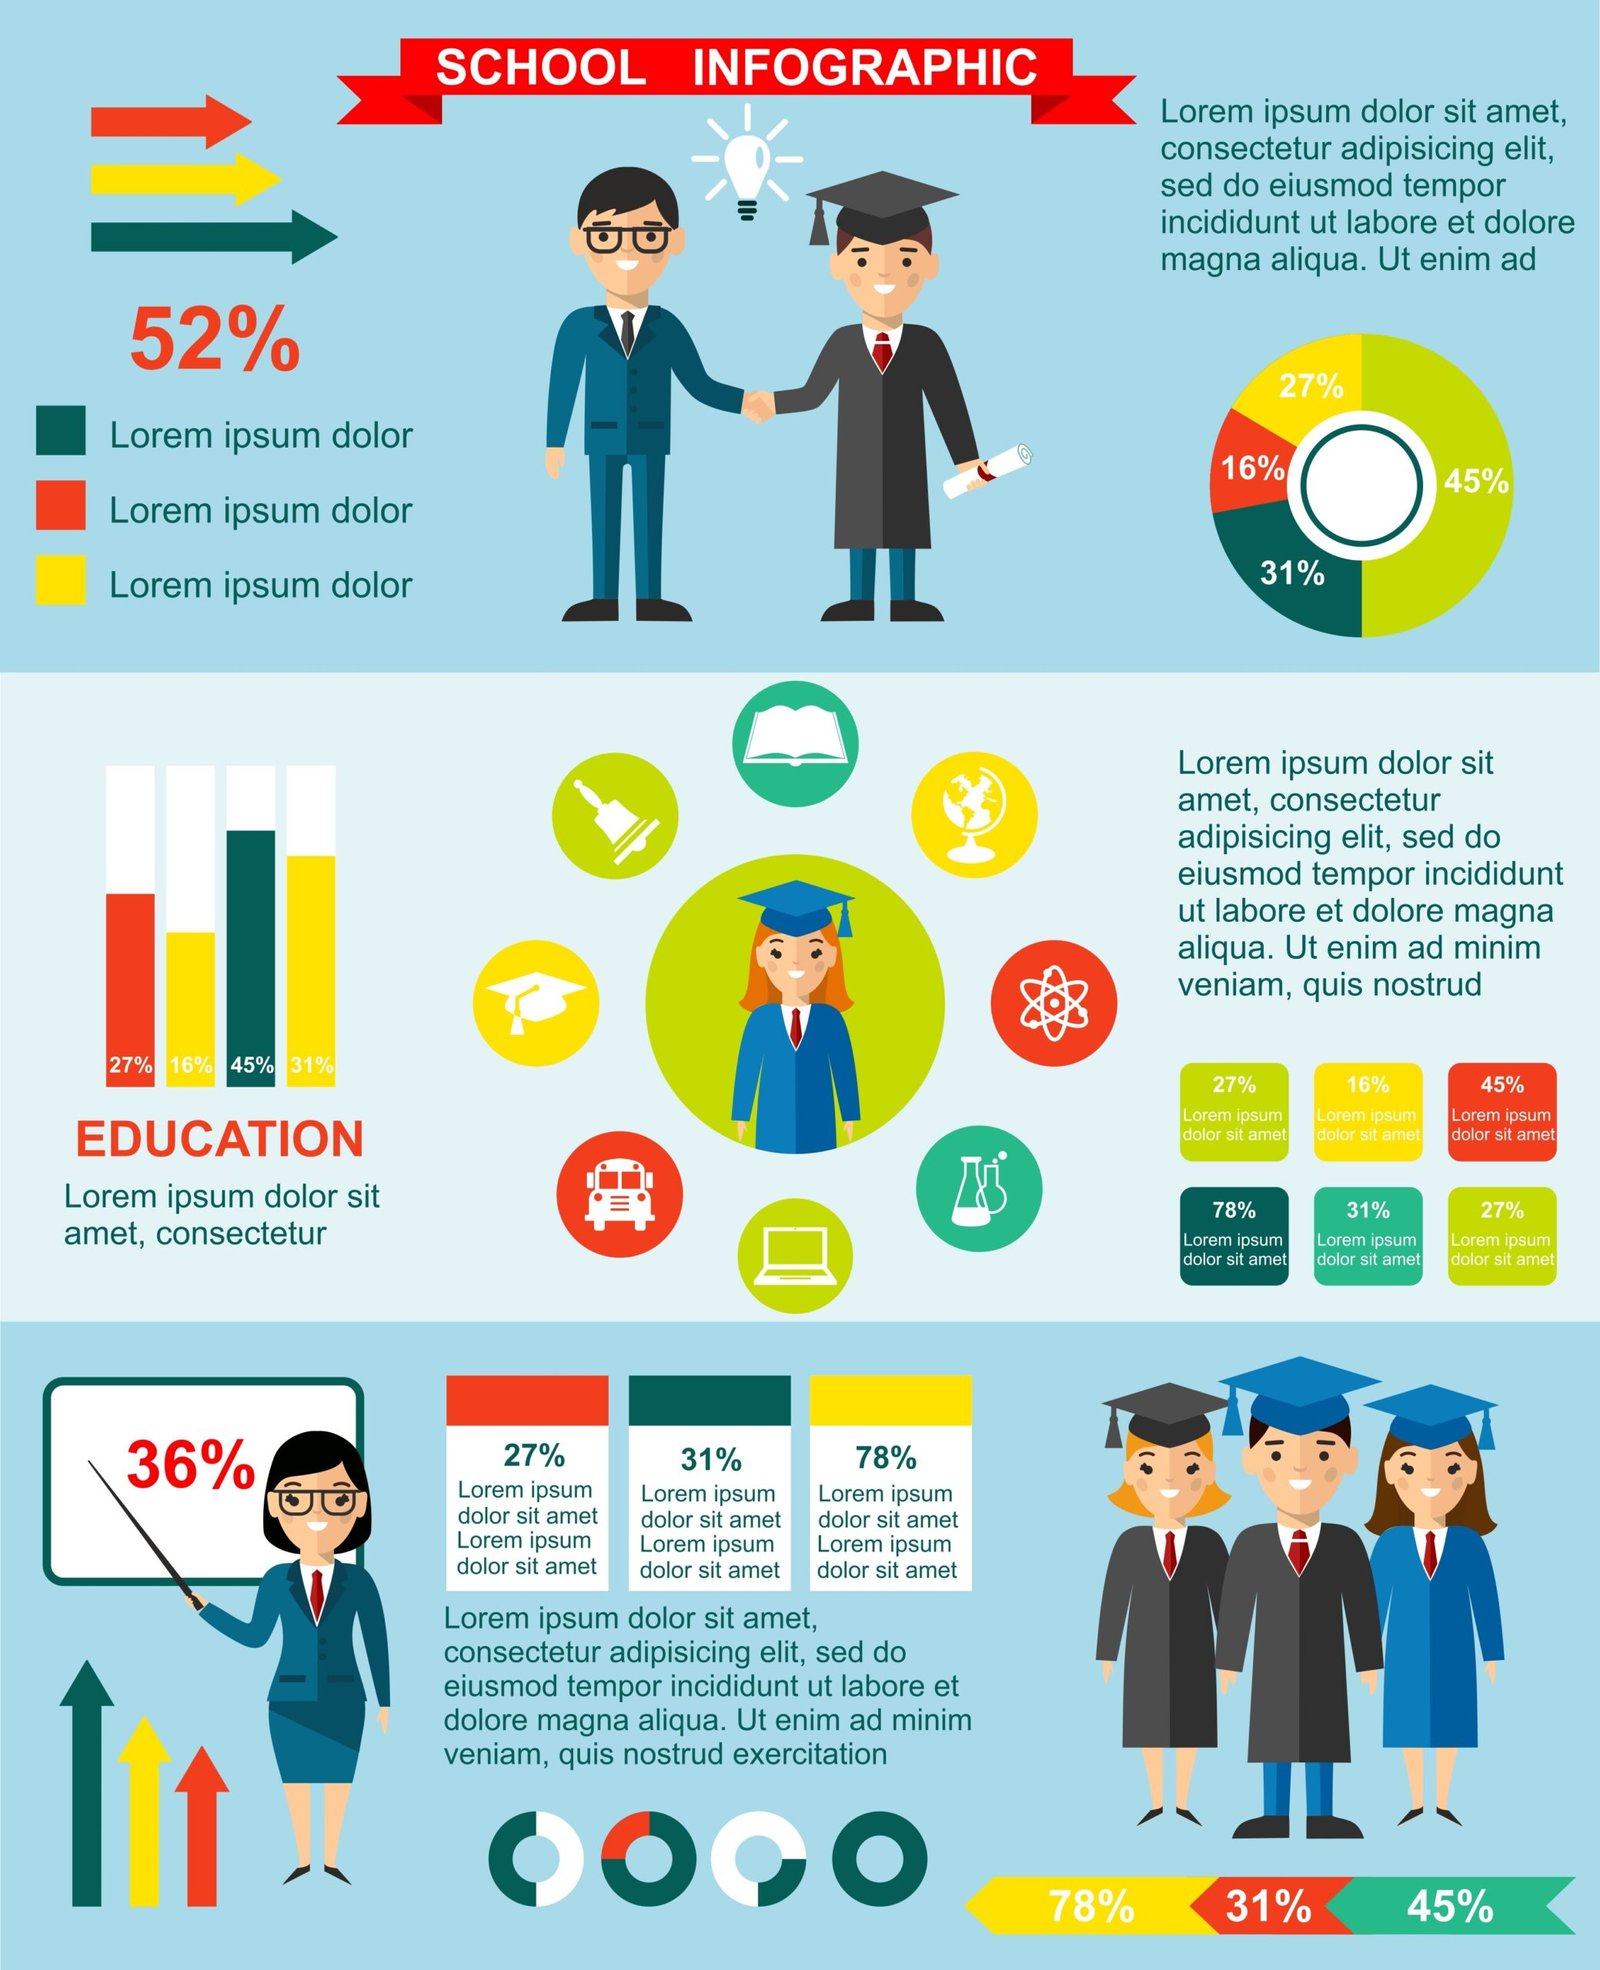
An infographic is a visual representation of information, data, or knowledge. It combines images, illustrations, icons, graphs, and minimal text to simplify complex ideas, highlight key insights, or break down information into an easily digestible and recallable format.
Today’s infographics are no longer limited to just static visuals or text. In 2025, they include:
- Interactive representation of data, facts, or figures
- Motion graphics and animated data
- Scroll-based storytelling visuals
- Integrated ideas for social media
Regardless of the chosen format, their purpose remains the same: to make information engaging, accessible, and memorable.
Why Infographics Still Work: Data-Backed Facts
1. People Process Visuals 60,000x Faster Than Text
According to studies by 3M and the University of Minnesota, the human brain processes visuals dramatically faster than text. In a digital world flooded with words, visual content helps to cut through the clutter, making the process of understanding, retaining, and recalling that information a lot easier.
Infographics can increase information retention by up to 65%, compared to 10% for text alone.
2. Infographics Are Highly Shareable Content
Infographics consistently outperform other content types when it comes to shares, backlinks, and virality.
HubSpot reports that infographics are shared on social media 3x more than any other type of content.
Because of their visual appeal and compact format, they’re ideal for:
- LinkedIn and B2B content marketing
- Pinterest, Twitter, and Instagram posts
- Blog visuals and email marketing
3. They Boost SEO Performance
Infographics are SEO ‘gold’ when used correctly because they:
- Increase time spent on page
- Encourage natural backlinks (especially if embedded with original data)
- Improve user engagement signals that Google loves
A study by Moz showed that high-quality infographics can earn up to 37% more backlinks than standard blog content.
4. They Simplify Complex Data
In sectors like healthcare, finance, legal, education, and technology, infographics are indispensable. They turn dense reports, statistics, and jargon into digestible narratives that everyone can understand.
Therefore, infographics help tremendously when it comes to:
- Explain processes (e.g., legal procedures, medical symptoms, customer journeys)
- Compare products or data points
- Summarize reports or whitepapers
In 2025, clarity equals credibility—infographics deliver both!
5. They Enhance Brand Authority & Professionalism
Well-designed infographics elevate your brand by showing:
- You understand your audience’s pain points
- You have command over complex topics
- You invest in quality visual communication
Furthermore, infographics build trust and authority, especially when branded consistently and supported by credible sources.
Companies using custom infographics in marketing materials see a 12% increase in perceived professionalism according to a 2024 Canva insights report.
6. Infographics Work across ALL Platforms
Here’s another genuine reason why infographics are still thriving: versatility.
Infographics can be repurposed into:
- Social media carousels
- Email headers or infobites
- Slides in presentations
- Sections within blog posts
- Short animated videos
With AI design tools and platforms becoming more accessible, along with the latest in-house infographic design tools, infographics can now be adapted to your industry and audience faster and smarter than ever before.
Emerging Trends in Infographics for 2025
As the design landscape evolves, so do the ways infographics are created and consumed.
Here are the top infographic trends shaping 2025:
Interactive Data Visualisation
Clickable, scrollable infographics embedded on websites or dashboards let users explore data at their own pace.
Motion Infographics & Reels
Animated infographics for TikTok, YouTube Shorts, and Instagram Reels boost retention, making them ideal for data storytelling.
Voice-Activated & AR-Enabled Visuals
Voice search compatibility and AR-infographics (e.g., real-time stats through your phone camera) are starting to appear in more technologically advanced marketing campaigns.
Data Personalisation
Customised infographics generated for each user based on their behavior, location, or purchase history are now possible with automation tools.
How to Make Infographics Work for You in 2025
Here are best practices to follow when integrating infographics into your 2025 content strategy:
✅ Focus on one core message
Don’t overload your design. Choose a single idea and structure everything around it.
✅ Use original data when possible
Infographics backed by proprietary data get more credibility, backlinks, and media attention.
✅ Design for mobile first
Ensure your visuals are readable and scrollable on smartphones as well as other mobile and handheld devices.
✅ Add Alt Text and Schema Markup
In doing so, you will improve accessibility and make your content more SEO-friendly.
✅ Brand it consistently
Use your brand colors, fonts, and logo so viewers remember who created it.
Real Results: Why Clients Still Choose Infographics
At InfographicsDesigners.co.uk, we’ve seen first-hand how custom-designed infographics have helped the businesses we’ve worked with:
- A fintech client increased email click-throughs by 52%
- A B2B SaaS brand tripled their backlinks in 90 days
- A healthcare startup simplified pitch deck data and closes Series A funding
With infographics in 2025, no matter how much the format evolves, their ability to tell compelling and memorable stories will remain unmatched.
Final Thoughts
In 2025, attention is the currency and infographics are still one of the best ways to earn it. They simplify, clarify, and beautify the data your audience needs to understand. They inspire action, subtly but effectively guiding your audience to find solutions to day-today problems and challenges.
Whether you’re a startup looking to make an investor pitch, a marketer planning a new campaign, or a business trying to explain the value proposition of your services, infographics remain one of the smartest tools to leverage in your digital arsenal.