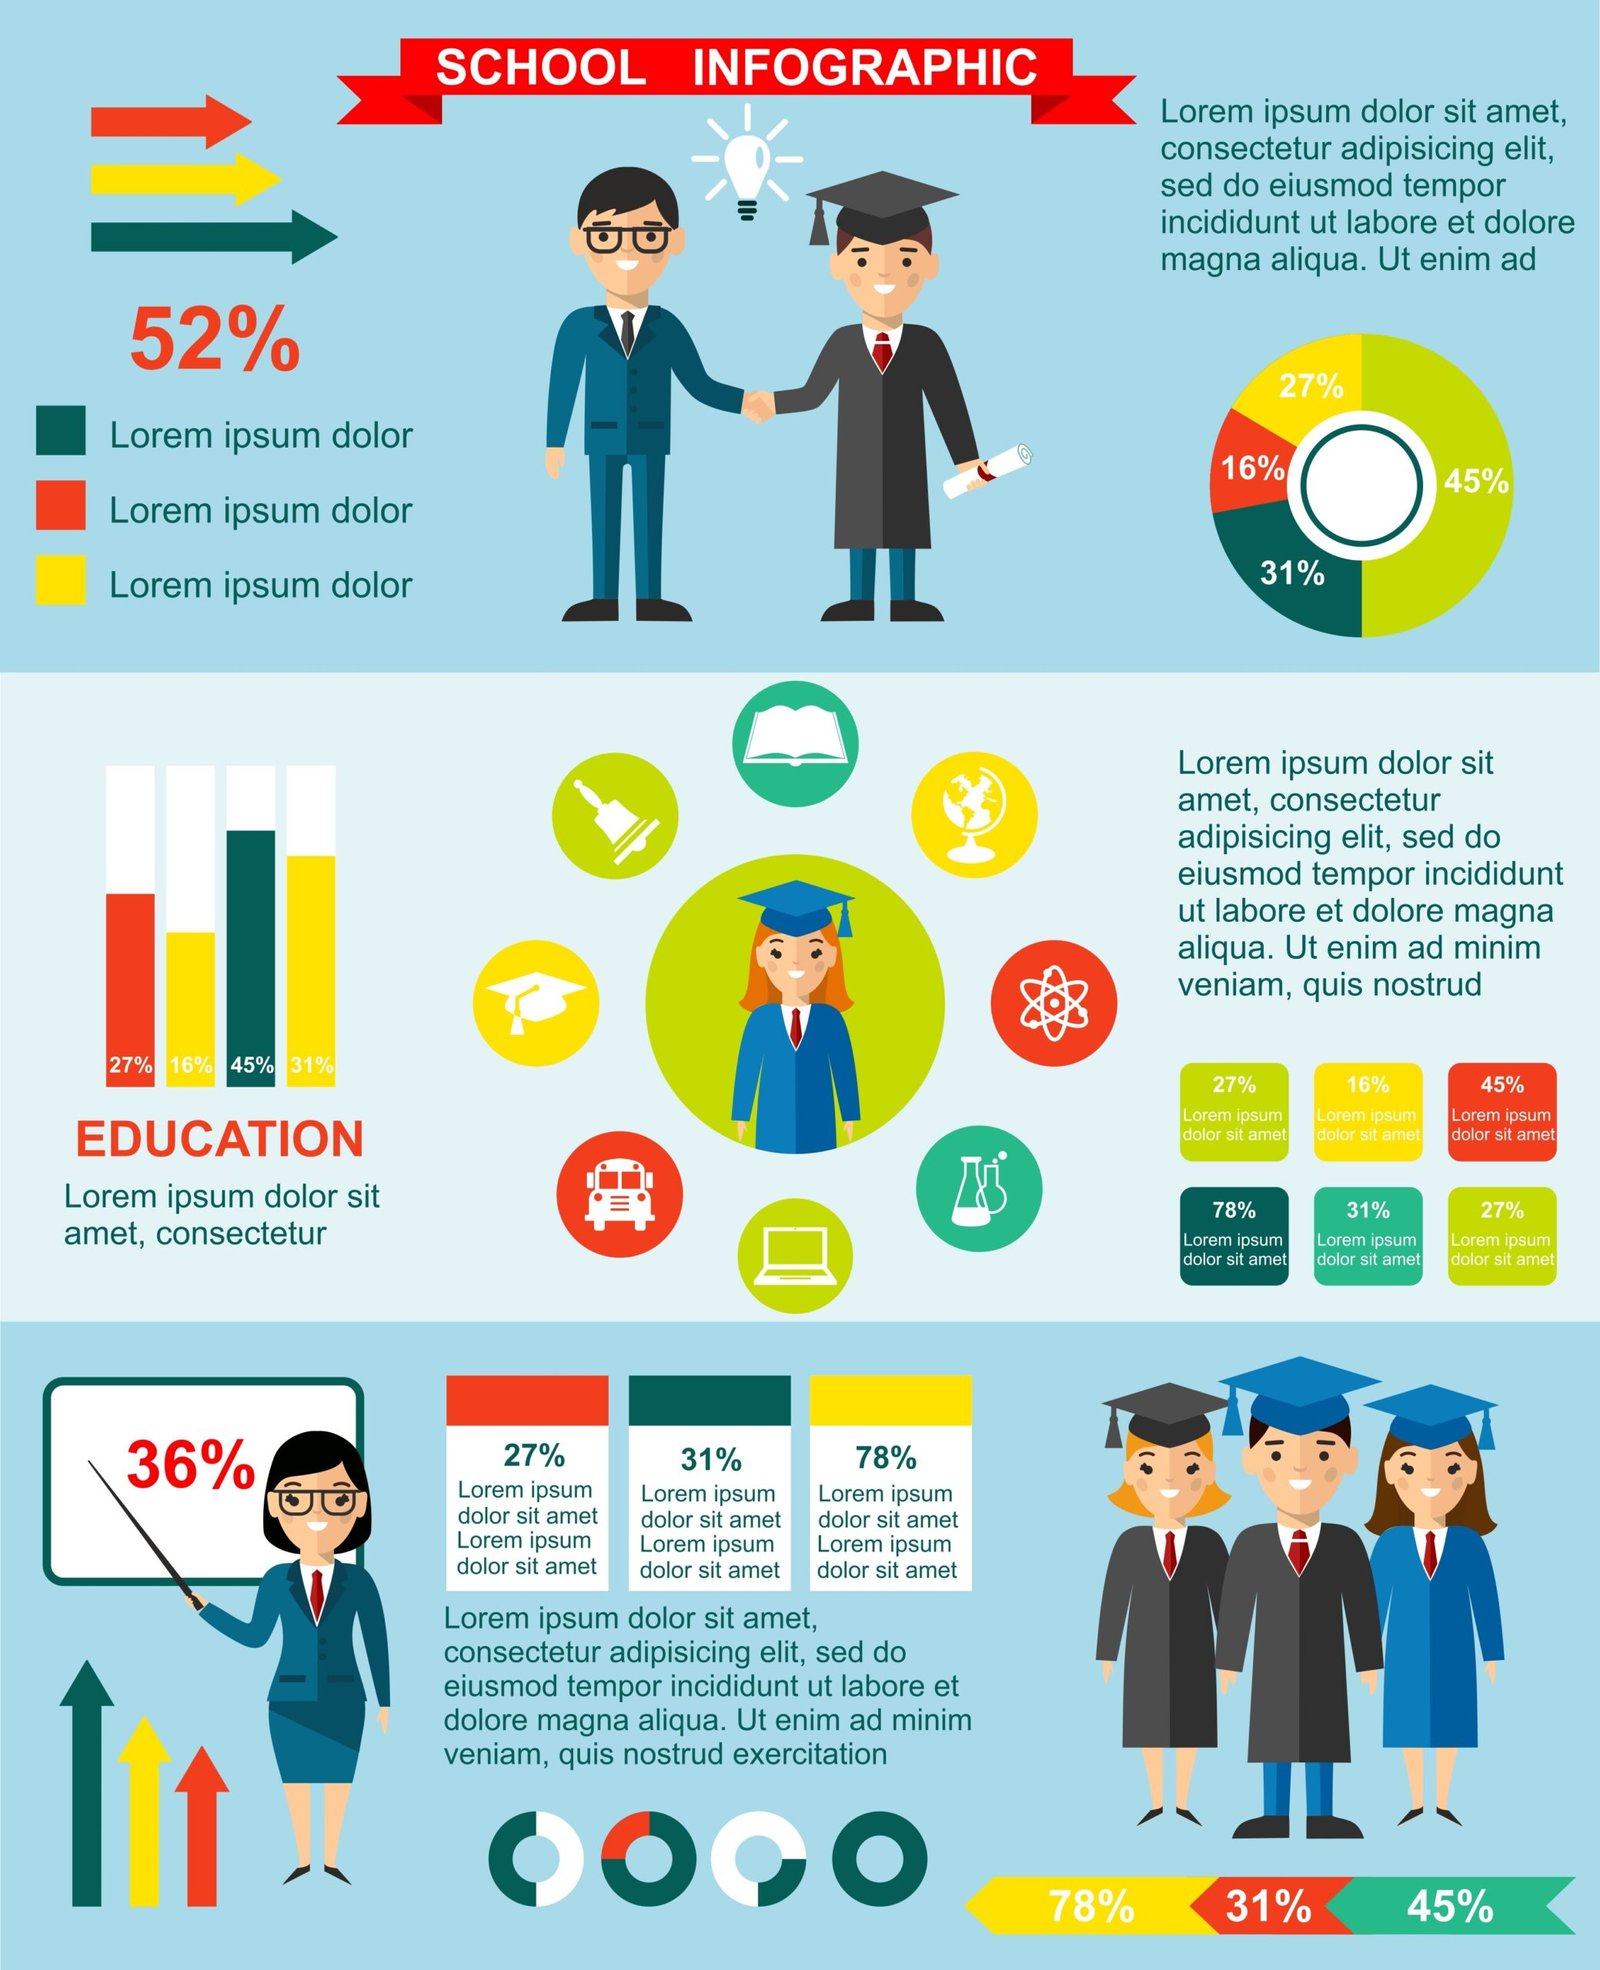
From bold typography to AI-powered tools, the top infographic design trends in 2025 are reshaping how we craft and consume data narratives. As we look forward to 2026, infographics are becoming more immersive, inclusive, and intelligent than ever, and so, we’ve curated the top infographic design trends in 2025 that will dominate.
Dive right in to stay ahead, elevate your visuals, and keep your audience nicely engaged and informed!
1. Bold, Expressive Typography
Why it matters: In 2025, typography is doing more than conveying text—it’s making statements. Large, expressive fonts are being used as central design elements, not just headlines. This technique grabs attention and sets the tone immediately.
How to apply:
- Use oversized display fonts for headlines.
- Combine serif and sans-serif styles for dynamic contrast.
- Use vibrant colours to highlight key data points.
2. Playful, Asymmetrical Layouts
Why it matters: Moving away from strict grids, designers are embracing freeform and asymmetrical layouts that feel spontaneous and engaging.
How to apply:
- Arrange text and graphics in diagonal or circular flows.
- Create visual “paths” guiding the reader.
- Maintain as much clarity as possible even with dynamic layouts.
3. AI-Assisted Infographic Creation
Why it matters: AI tools are democratising infographic creation by handling chart layout, colour choices, and even data interpretation. However, the human touch remains critical.
How to apply:
- Use AI generators to create initial drafts only.
- Manually refine layouts, ensure brand consistency, and verify accuracy.
- Experiment but avoid over-reliance on AI until and unless responsible and accurate results are provided. Again, the human touch cannot be eliminated entirely!
4. Accessibility and Inclusivity
Why it matters: Designing with accessibility in mind helps reach a wider audience and improves overall readability.
How to apply:
- Use high contrast colours and clear, legible fonts.
- Ensure graphics are screen-reader-friendly.
- Add alt-text, simple descriptions, and accessible downloadable formats.
5. Interactive Storytelling
Why it matters: Static visuals are still effective, but interactive infographics—with hover effects, embedded video, and clickable charts—offer deeper engagement.
How to apply:
- Integrate tooltips or click-to-expand features.
- Embed videos, animations, or mini-visualizations.
- Track engagement stats to refine user journey.
6. SEO-Friendly and Shareable Designs
Why it matters: Infographics are link magnets when they answer search queries clearly. SEO principles applied visually can boost organic reach and backlinks.
How to apply:
- Design infographics for specific queries (“how does X work?”).
- Use SEO-friendly filenames, captions, and compression for fast loading.
- Include embed codes for easy sharing.
7. Micro-Infographics for Social
Why it matters: In bite-sized pieces, micro-infographics are made for quick consumption across social platforms—they highlight one stat or tip, designed to go viral.
How to apply:
- Create square or vertical mini designs.
- Center a powerful stat or insight.
- Maintain balanced branding and legibility at small sizes.
8. Deep-Dive Subject Matter Visualizations
Why it matters: Industry-specific, in-depth infographics are increasingly popular. Niche data visualizations—on topics like fintech trends or travel stats—demonstrate expertise and shareability.
How to apply:
- Choose a focused topic with expert-level detail.
- Use layered visuals, legends, and progressive disclosure.
- Simplify complexity with clear visuals and structured layout.
9. AI-Generated Imagery & Textures
Why it matters: AI-sourced illustrations and textured grains add character, depth, and uniqueness to designs—especially useful when hand-crafted visuals are either impractical, costly, or too time consuming.
How to apply:
- Use AI to generate background textures or abstract imagery.
- Apply subtle grain overlays (5–15% opacity) for depth.
- Blend textures with clean graphs to maintain clarity.
10. Bold Minimalism & Negative Space
Why it matters: Maximalist trends are now paired with bold minimalism: striking focal points and clean layouts that allow data to breathe.
How to apply:
- Focus on one main chart and visual.
- Use white space to guide the eye.
- Pick two to three colors—simple, impactful, sweet, and to the point!
11. Retro Serif & Nostalgic Typography
Why it matters: Vintage fonts are back—nostalgic serif styles add warmth, trust, and character to data visuals in a fresh context.
How to apply:
- Use serif fonts for headers or section titles.
- Pair with modern sans-serifs for readability.
- Accent with vintage shades like muted reds and navy.
12. Augmented & Embedded Motion
Why it matters: Movement—subtle animations and scroll-triggered effects—bring static visuals to life and increase engagement on digital platforms.
How to apply:
- Animate data transitions and entry fades.
- Embed in-page on websites using Lottie or GIFs.
- Ensure cross-device compatibility and accessibility.
13. Geo-Infographics and MapCraft
Why it matters: Maps are essential for location-based data. Tools supporting custom, interactive geographic visuals—Cartograms and flow maps—enhance storytelling.
How to apply:
- Use choropleth or symbol maps for spatial trends.
- Label clearly with legends and colour coding.
- Add interactive zoom or highlight features for web versions.
14. Text-Visual Integration & Circular Layouts
Why it matters: Study shows embedded text in visuals—especially circular designs—enhances reader pleasure and recall.
How to apply:
- Embed short captions within shapes or around charts.
- Use radial headings in circular diagrams.
- Ensure readability meets accessibility standards.
15. “Juicy” vs. “Dry” Engagement Balance
Why it matters: Studies have revealed that slightly “juicy” interactive elements increase engagement—without sacrificing retention, if balanced carefully.
How to apply:
- Add subtle micro-interactions on hover.
- Avoid overwhelming animations.
- Prefer smooth transitions and simple cues.
16. Inclusive Design and Multilingual Layouts
Why it matters: As audiences diversify, so must infographics. Multilingual support and inclusive visuals are increasingly becoming vital.
How to apply:
- Design with space for multiple languages.
- Use icons representing diverse demographics.
- Localise colour palettes and cultural references.
17. Micro-Illustrations & Iconography
Why it matters: Micro-illustrations and icon sets support storytelling, particularly in dense or mobile formats.
How to apply:
- Use consistent, bespoke icon sets.
- Simplify complex data with small visuals.
- Align styles (outline vs flat vs 3D) with overall design.
Practical Toolkit: Adopting 2025 Trends
- Audit Your Style – Which current trends are missing?
- Pilot a Micro-Infographic – Test layout, icons, headline focus.
- Incorporate Interactivity – Start with hover tooltips.
- Ensure Accessibility – Test contrast and readability.
- Use AI Responsibly – Apply AI for ideation, not final flairs.
- A/B Test – Track engagement and iterate.
Future Outlook: Beyond 2025
As far as the top infographic design trends in 2025 go, we strongly foresee the following:
- AI personalization: Infographics tailored per user in real time.
- Multi-sensory design: Sound-enhanced visuals and immersive formats.
- Sustainable visual ethics: Data accuracy and inclusive depiction as core values.
Summary Table of Top Infographic Design Trends in 2025
| Trend | Application Example |
| Bold Typography | Headlines that dominate hero sections |
| Playful Layouts | Diagonal flow with overlapping visuals |
| AI-Assisted Design | Auto-generated chart layouts |
| Accessibility Features | High-contrast colours, alt-text |
| Interactive Storytelling | Clickable data spots with hover tooltips |
| SEO-Friendly Approach | Infographic answering FAQ queries |
| Micro-Infographics | Single-stat social posts |
| Deep-Dive Visuals | Industry-specific breakdowns |
| AI-Generated Textures | Grainy filters adding tactile feel |
| Bold Minimalism | Clean designs with focus emphasis |
| Retro Typography | Vintage serif for brand trust |
| Animated Visuals | Fade-ins and kinetic scrolling |
| Geo-Infographics | Interactive choropleth maps |
| Embedded Text in Visuals | Text integrated inside circular diagrams |
| Juicy vs Dry Balance | Subtle interaction without distraction |
| Inclusive Layouts | Bi-directional language support |
| Micro-Illustrations | Icon sets enhancing mobile clarity |
Final Thoughts on Top Infographic Design Trends In 2025
In 2025 and beyond, the best infographics blend visual flair with inclusivity, engagement, and interactivity. From bold typography to SEO optimization, these trends reflect a shift to smarter, more emotionally intelligent data storytelling.
By integrating interactivity, accessibility, AI support, and user-centric layouts, your infographics can resonate deeply and perform exceptionally—capturing attention and trust in equal measure.
Let the expert team at InfographicsDesigners.co.uk help you bring these trends to life, share your requirements now to explore tailored solutions, bespoke designs, and performance-driven visuals.