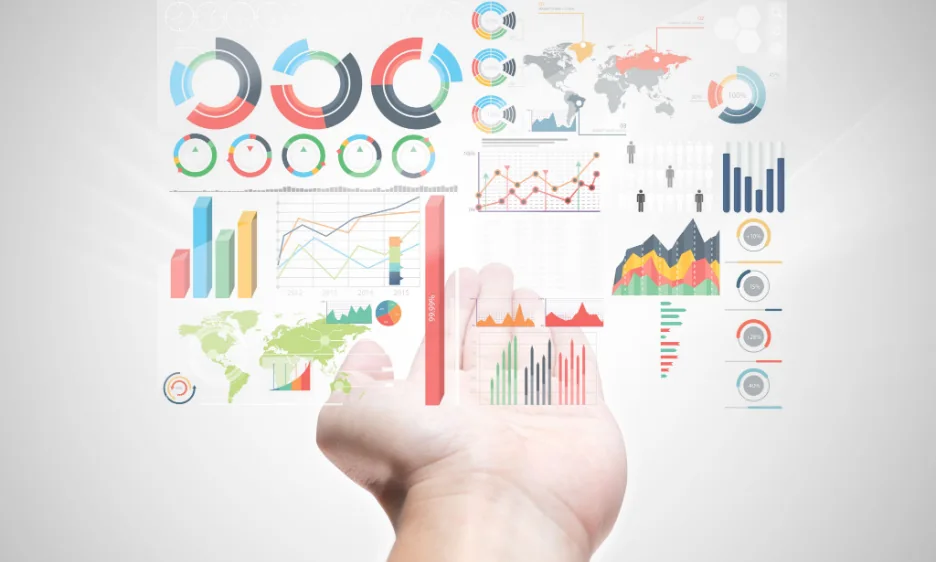
Overview: Healthcare Infographics Now Matter More Than Ever
In the era of data-driven healthcare, the medical industry is generating an unprecedented amount of information—from patient records and clinical trial results to wearable device statistics and global health research. However, raw data can be overwhelming for patients, practitioners, and policymakers. Keep reading as we uncover eye-opening infographic trends in healthcare data for 2026.
To make things easier for all parties involved, this is where healthcare infographics come in, transforming complex medical data into clear, accessible, and actionable visuals. By 2026, infographics are set to become the dominant medium for communicating healthcare information, driven by AI technology, real-time data, and personalised medicine.
In this article, we explore the top infographic trends shaping healthcare data in 2026 and how they are transforming the way we understand and act on health information.
AI-Generated Healthcare Infographics
Artificial Intelligence is becoming a game-changer in medical data visualisation. In 2026, AI-powered tools can instantly convert complex datasets into easy-to-read infographics.
Why it matters:
- Saves time for healthcare professionals who need quick insights.
- Automatically adapts visuals to different audiences—patients, doctors, or policymakers.
- Highlights patterns and predictions using AI analysis.
Example:
Hospitals using AI-driven dashboards that automatically generate infographics to show daily patient flow, bed availability, and infection control statistics.
Real-Time Health Data Visualisation
With the rise of wearable technology and IoT-enabled medical devices, real-time health tracking is becoming standard. By 2026, healthcare infographics will increasingly be live, interactive, and continuously updated.
Key uses:
- Patient monitoring: Showing live heart rate, blood oxygen, and glucose levels in an easy-to-read format.
- Public health: Real-time epidemic tracking maps for government and media.
- Hospital performance: Live dashboards showing surgery wait times or ER capacity.
Example:
An interactive infographic that updates every second to display pandemic recovery rates, vaccination numbers, and regional health alerts.
Personalised Medical Infographics
Healthcare is shifting towards personalised medicine, and infographics are adapting to show patient-specific insights.
Why it works:
- Patients receive reports tailored to their own health data.
- Encourages better patient engagement in managing chronic conditions.
- Simplifies treatment explanations for non-medical audiences.
Example:
A diabetic patient receiving a custom infographic showing their monthly blood sugar patterns, dietary impact, and personalised recommendations.
Interactive 3D Medical Infographics
Static images are giving way to interactive 3D visuals that allow users to explore anatomy, disease progression, and treatment effects.
Applications:
- Patient education: Explore the human body in 3D to understand surgical procedures.
- Medical training: Visualising internal organs and health conditions for student learning.
- Public awareness: Interactive maps showing regional disease outbreaks.
Example:
A 3D interactive model showing how cancer cells grow and how treatment stops their spread.
Mobile-First Healthcare Infographics
By 2026, most patients will likely be able to access their health information via mobile devices. This means healthcare infographics must be optimised for mobile viewing.
Best practices:
- Vertical layouts for easy scrolling.
- Simplified text for quick understanding.
- Tap-to-expand sections for detailed insights.
Example:
A public health mobile app showing a daily nutrition infographic designed to be read in under 30 seconds.
- Data Storytelling in Public Health Campaigns
Storytelling is becoming a core component of healthcare infographics in 2026. Instead of just showing numbers, infographics will tell a narrative.
Why it’s effective:
- Creates emotional engagement with health topics.
- Encourages behaviour change through relatable examples.
- Helps communities understand the impact of health challenges.
Example:
An infographic campaign narrating a day in the life of a patient managing asthma, integrating statistics, tips, and relatable visuals.
- Multilingual and Inclusive Infographics
Healthcare information must be accessible to all, especially in diverse, multicultural populations.
2026 trends:
- Multiple language versions in a single interactive infographic.
- Culturally relevant imagery for local populations.
- Accessibility features for people with visual impairments.
Example:
A WHO infographic about vaccination benefits, available in 10+ languages, with screen-reader compatibility.
- Predictive Healthcare Infographics
Thanks to big data and predictive analytics, 2026 healthcare infographics can forecast future health trends.
Applications:
- Hospital resource planning: Predicting bed shortages during flu season.
- Public health strategy: Forecasting disease outbreaks.
- Patient care: Anticipating risk factors for chronic illnesses.
Example:
An infographic showing predicted flu spread for the next three months, helping local clinics prepare.
Gamified Health Infographics
Gamification makes healthcare engaging and interactive, encouraging participation and learning.
Examples:
- Infographics showing progress towards fitness goals.
- Health quizzes embedded within visual content.
- Reward-based dashboards for chronic condition management.
Example:
An interactive diabetes management infographic where patients unlock badges for consistent blood sugar tracking.
Sustainability and Eco-Friendly Design in Medical Visualisation
As sustainability becomes a global priority, healthcare infographic design in 2026 will also focus on eco-conscious production.
Approaches:
- Digital-first design to reduce printing.
- Use of energy-efficient hosting for interactive infographics.
- Minimalist designs to reduce data load and energy use.
Infographics Trends in Healthcare Data: Why Infographics will be a Leading Medium in 2026
For Patients
- Simplifies complex data into understandable visuals.
- Encourages self-care and informed decision-making.
- Reduces anxiety by making medical information less intimidating.
For Healthcare Professionals
- Saves time in explaining treatments.
- Improves patient compliance with care plans.
- Facilitates communication between multidisciplinary teams.
For Public Health
- Raises awareness of key health issues.
- Engages communities in preventative care.
- Supports faster decision-making during crises.
How to Implement Healthcare Infographics in 2026
If you’re a hospital, clinic, public health agency, or health brand, here’s how to use these trends:
- Adopt AI-powered tools to generate infographics quickly.
- Invest in interactive platforms for real-time updates.
- Personalise reports for patient engagement.
- Test mobile-first designs before launching campaigns.
- Collaborate with professional infographic designers for high-impact visuals.
Conclusion: The Future of Healthcare Infographics is Clear, Interactive, and Personal
By 2026, infographics will be the backbone of healthcare communication. From AI-driven medical dashboards to personalised patient visual reports, the future points towards more intelligent, interactive, and inclusive health visuals.
These infographic trends in healthcare data for 2026 reveal telltale signs that infographics will be a leading medium in the years to come, helping patients enjoy an improved level of care and healthcare providers improve their service delivery in remarkable ways.
Whether you’re looking to educate patients, train medical professionals, or run public health campaigns, adopting these infographic trends can help you communicate effectively, improve outcomes, and build trust.
At Infographics Designers, we specialise in data-driven healthcare visualisation—from interactive dashboards to AI-powered infographics. Ready to turn your healthcare data into clear, impactful visuals? Get in touch with us today.