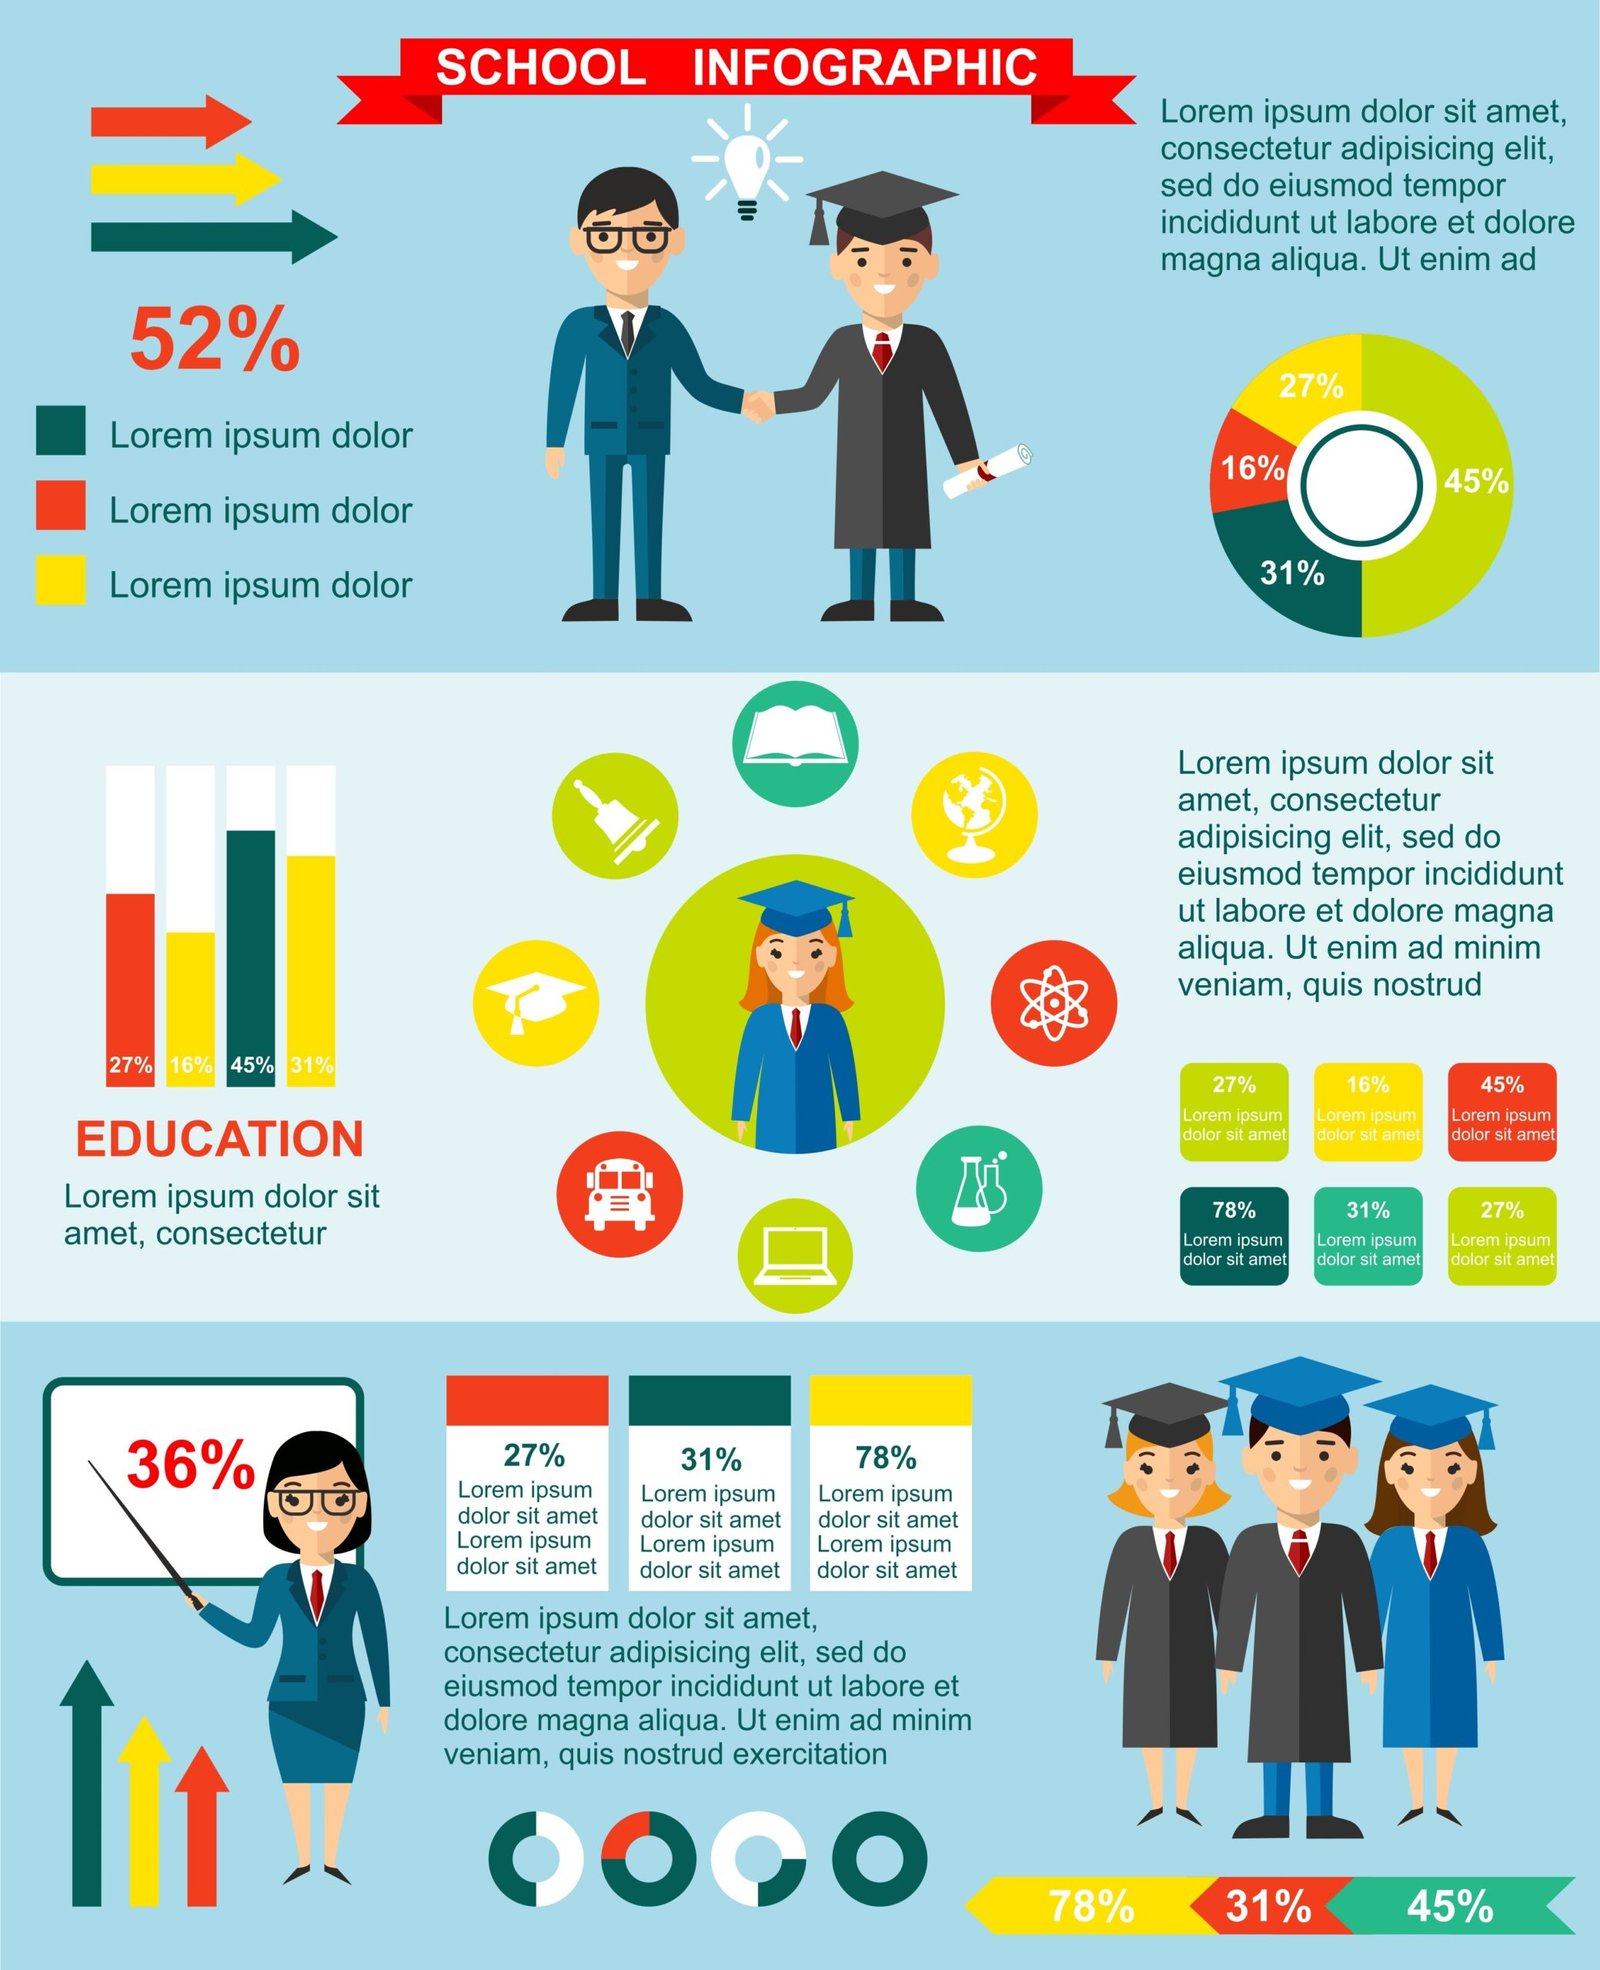
A well-designed infographic has the power to turn complex data into a story that’s engaging, clear, and easy to remember. But behind every great infographic is an even greater design brief — a document that guides your creative team toward the right message, tone, and visuals.
Whether you’re a business owner, marketer, or agency partner, knowing what to include in an infographic design brief can save time, reduce revisions, and ensure your final design hits the mark.
This guide outlines everything you should include in a strong infographic brief — with tips from our team at InfographicsDesigners.co.uk, the UK’s leading infographic design agency.
Why a Strong Design Brief Matters
Think of a design brief as your blueprint. Without it, your infographic team is left guessing, which often leads to:
- Misaligned goals
- Off-brand visuals
- Multiple revisions
- Delayed timelines
A detailed infographic design brief helps:
- Clarify your core message
- Define your visual preferences
- Align your team with the designer’s process
- Speed up delivery and feedback cycles
What to Include in Your Infographic Design Brief
Here’s a breakdown of all the essential elements to make your infographic brief clear, complete, and collaboration-ready.
Project Overview
Start with a short introduction that answers:
- What is the infographic about?
- Why is it being created?
- What do you hope to achieve?
Here’s an example:
“We need a static infographic to explain the carbon footprint of delivery vehicles across Europe. This will be used in a LinkedIn campaign targeting sustainability decision-makers.”
It’s simple, concise, to the point, and lets the team know exactly where to begin, saving time, energy, and more!
Target Audience
Knowing who you’re speaking to shapes the design, tone, and level of complexity.
Include:
- Industry (e.g. finance, healthcare, education)
- Job roles (e.g. C-suite, students, general public)
- Geographic region (UK, global, Arabic-speaking, etc.)
- Demographics (age, language, culture)
Tip:
If your audience isn’t highly technical, tell the designer to avoid jargon and use simpler visual metaphors. Makes life easier for everyone involved!
Core Message & Key Takeaways
Clearly list:
- The main message the infographic should communicate
- 3–5 key points or data insights to include
Example:
Main Message: “AI is reshaping UK businesses in 2025.”
Key Points:
- 73% of UK SMEs have adopted AI
- Automation improves productivity by 24%
- Challenges include budget, training, and data privacy
Avoid vague goals like “make it interesting”. Always be specific.
Type of Infographic
Mention the format or style you need:
- Static infographic (JPEG or PNG)
- Interactive infographic (HTML5/scrollable)
- Motion infographic (video or animation)
- Carousel format (for LinkedIn or Instagram)
- Vertical or horizontal layout
If you’re unsure, your design team can guide you — but it helps to give direction early.
Content & Data (With Sources)
Include all the text, statistics, and facts you want the designer to visualise. If possible, organise it into sections or steps.
- Use bullet points, headings, and subheadings
- Provide accurate and verified data
- Add source links (e.g. gov.uk, Statista, in-house research)
Important:
Highlight any must-use numbers or quotes that should stand out in the final visual.
Branding Guidelines
To keep the infographic on-brand, share:
- Your logo (SVG or PNG)
- Brand colours (HEX or RGB codes)
- Preferred fonts (or suggest similar ones)
- Any visual examples (previous infographics, social posts, brochures)
If you don’t have a full brand guide, even a basic visual reference is helpful.
Tone and Style Preferences
Describe the tone of voice and visual feel you’re aiming for:
- Formal, corporate, friendly, playful, minimalist, etc.
- Flat design, illustrated, 3D, icon-based, hand-drawn
- Colour preferences or themes (e.g. eco-friendly greens, finance blues)
Examples:
“Keep the tone professional, suitable for LinkedIn B2B readers.”
“We prefer isometric-style illustrations and clean lines.”
You can also link to reference infographics you admire.
Usage and Distribution Channels
Tell your designer where the infographic will be published:
- Website or blog
- Social media (Instagram, LinkedIn, Pinterest, X)
- Email campaigns
- Press releases or downloadable PDFs
- Slide decks or print materials
This helps define the size, resolution, and format the final file should be delivered in.
Call to Action (CTA)
If your infographic will be shared publicly, what action should viewers take next?
Examples:
- Visit your website
- Book a consultation
- Subscribe to your newsletter
- Download a full report
- Follow on social media
Including a CTA ensures your infographic drives measurable results, not just visual impact.
Timeline and Deadlines
Be upfront about your timeline:
- Ideal start date
- First draft deadline
- Final delivery date
- Any events or launches the infographic needs to support
Pro Tip:
Allow time for at least 1–2 rounds of feedback before the final version.
Budget Range (Optional but Helpful)
If your design project has a set budget or range, it’s helpful to mention this upfront. It helps the agency recommend the best approach within your limits — for example, choosing a static graphic over animation or reducing the number of revisions.
Example Infographic Brief (Snapshot)
Here’s a quick summary of how all elements come together:
Project Title
“How UK Businesses Are Using AI in 2025”
Objective
To educate B2B audiences about AI adoption in UK companies using a visual, shareable format
Audience
Marketing & IT managers in UK SMEs
Key Points
73% AI adoption rate, productivity impact, major concerns
Format
Static infographic, vertical layout, web & LinkedIn use
Branding
Logo, colour palette, and font attached
Tone & Style
Clean, modern, corporate-friendly visuals
Deadline
First draft by July 10, final by July 15
Call to Action
“Download our full AI Strategy Report 2025”
Final Thoughts
A strong infographic design brief is the first step toward a compelling visual that informs, engages, and converts. The more clarity, structure, and direction you provide, the more efficiently your design team can bring your vision to life.
At Infographics Designers, we work closely with businesses, agencies, and public sector organisations to transform ideas into world-class visual content. Need help putting your brief together? Our team can guide you through every step.
Contact us today to start your infographic project the right way.